Rebuilding LunarCrush
LunarCrush · Head of Design, front-end governance · Feb 2026 to present · In progress
The 2026 redesign in progress: how we are rebuilding the product around AI-first behavior, what the data told us before we started, and the working sessions with Jon Farjo, our CPO, that have been shaping every decision since February.
This is the story of a rebuild that is still happening.
I have been the Head of Design at LunarCrush since January 2021. In almost six years I have helped take the product through several iterations, but the work I am writing about here is the most ambitious one I have ever been part of. We are rebuilding LunarCrush from the ground up: the product, the design system, the brand surface, the marketing site, and the data layer that powers every AI feature inside the app. The work has been moving fast since February of this year.
The way we work, the data that drove the decisions, and the surfaces that have come out of it are worth writing down while it is still fresh. So this is that record.
The team
The product I will show you below is not the work of a solo designer. It rests on three working relationships at LunarCrush: Joe Vezzani, our CEO, to whom I report; Jon Farjo, our Chief Product Officer and my day-to-day product partner; and Dan Williams, our CTO.
Jon and I run working sessions on a near-daily rhythm. Some are fifteen minutes; some run two hours. They are recorded and transcribed, and the decisions land in our shared workspace. The pace of the rebuild has only been possible because of the pace of those sessions. Almost every architectural call I will describe came out of one or more of those conversations: the topic-as-primitive decision, the six-level workspace shell, the rule that non-financial topics only show social metrics, the LLM fallback chain, the URL structure.
Joe sets the commercial direction. He decides which segments we serve, how we price, what the company says publicly, and where the product needs to go to make the business work. The audit findings, the MCP funnel data, and the rollout plan all sit on top of decisions he led.
Dan owns the backend and the data layer. The MCP server, the LLM fallback chain, the analytics infrastructure, and every API the new product app consumes were built and operated by him and his team. None of the architectural choices I describe in this case study would render without that foundation.
The credit and the responsibility belong to that team. What I can speak to is the design contribution: the decisions about what we are making, how it should feel, the system that supports it, and the front-end work I drive directly.
Why we are rebuilding
The starting point was an analytics audit we ran in February. It was uncomfortable to read.
Monthly churn was running at 15.7%, more than twice the 7% threshold most B2B SaaS treats as critical. The acquisition funnel told the story underneath: 28,600 visitors landed, 6,900 signed up, 1,197 paid, and roughly 60 came back. Acquisition was working. Retention was not.
The product split was just as stark. Half of our users never touched the API; the half that did generated 5.4× more activity (576K versus 107K requests over a 48-hour window). Our highest-value segment lived almost entirely outside the surfaces we were investing the most in.
The category context made it worse. The "destination website" model (go to a site, look at numbers, leave) was being absorbed by AI assistants, and the largest analytics destinations in our space were already pivoting in response: CoinGecko toward B2B infrastructure, CoinMarketCap toward bolting AI on top of an old UI.
There was one signal pointing in a different direction. The MCP server, our integration that lets Claude (and any other LLM) query our data directly, had grown into 43% of all signups, doubling weekly. More than 399 users had arrived through it. The catch was that almost none of them were converting to paid; the channel was producing distribution and no revenue.
That single channel was telling us where the product had to go. Users were not leaving us; they were arriving through their AI tool of choice and finding nothing to convert against. The web product had to be rebuilt around that reality, not against it.
The full strategic argument lives in the design rationale. What follows is the record of the rebuild itself.
The shape of the work
Since February 20 we have been shipping to a single branch. It currently holds more than 700 commits, and the pace has not slowed. More than 100 tickets have closed in the period.
The branch covers everything: the marketing site (which has its own case study), the design system, the brand page, the LLM router on the data side, and the new product app, which is the second wave and where the work is right now. The product is built on Next.js 16, React 19, ShadCN v4, Tailwind 4, TypeScript in strict mode, with Zustand for cross-panel state and TanStack Query for server state. It consumes our private API, an MCP-backed data proxy, and the Cloudflare Analytics Engine for telemetry.
The reason everything ships on one branch is that we share a token system, a component library, a brand identity, and a CI gate stack across all the apps. Trying to coordinate four parallel migrations would have made every release a small project on its own. Keeping the work in one place means that when the new product app starts to consume a token that did not exist three weeks ago, the marketing site already speaks the same vocabulary. There is no migration; there is a release.
The foundation
Underneath the rebuild is a small but heavily defended foundation.
Storm is the token package. 58 semantic tokens, dark and light themes in parity, no literal names. Surfaces, text, accents, and signals are all named for their meaning, not their hex value. The format is the W3C standard for design tokens, which is the only one with a real machine-readable spec. That decision unlocks an entire category of tooling I would otherwise have had to write: validators, build scripts, the MCP server I am working on for the design system itself. The tokens compile to JavaScript, CSS variables, and a Tailwind preset, and every component in every app reads from them.
The component library sits on top of the tokens. It is built on ShadCN v4 with Base UI under the hood, and it is shared between the marketing site, the product app, and the brand page. There is no second-class citizen. When I build a new pattern, every surface in every app picks it up at the next build. A recent example is a universal avatar component that handles fallback chains for any kind of topic.
The brand page lives at the root of the marketing site, currently password-protected. It is the system, not a document about the system. Logos in six variants with a downloadable bundle, the full color system, the typography stack, the iconography, motion tokens, voice and tone, social-media guidelines, and the AI image-generation prompts that keep our generated visuals on-brand. The page imports from the same token package as the apps, so when a token changes, the brand page changes with it.
CI runs on every pull request: token validation, TypeScript, lint, full build. The first version of the pipeline caught a handful of TypeScript errors in the marketing site that had been silently shipping to production for weeks. We tracked them, did not block on them, and have been catching everything else since.
The surfaces
The first wave of this branch was the public marketing site. The second wave, where the work is now, is the new product app: the surface a user sees after they sign in. What follows is a walk through it.
Sign-in
Every product begins where the new user does. We have taken sign-in back to the minimum it needs to be: the logo, a tagline, three ways in.
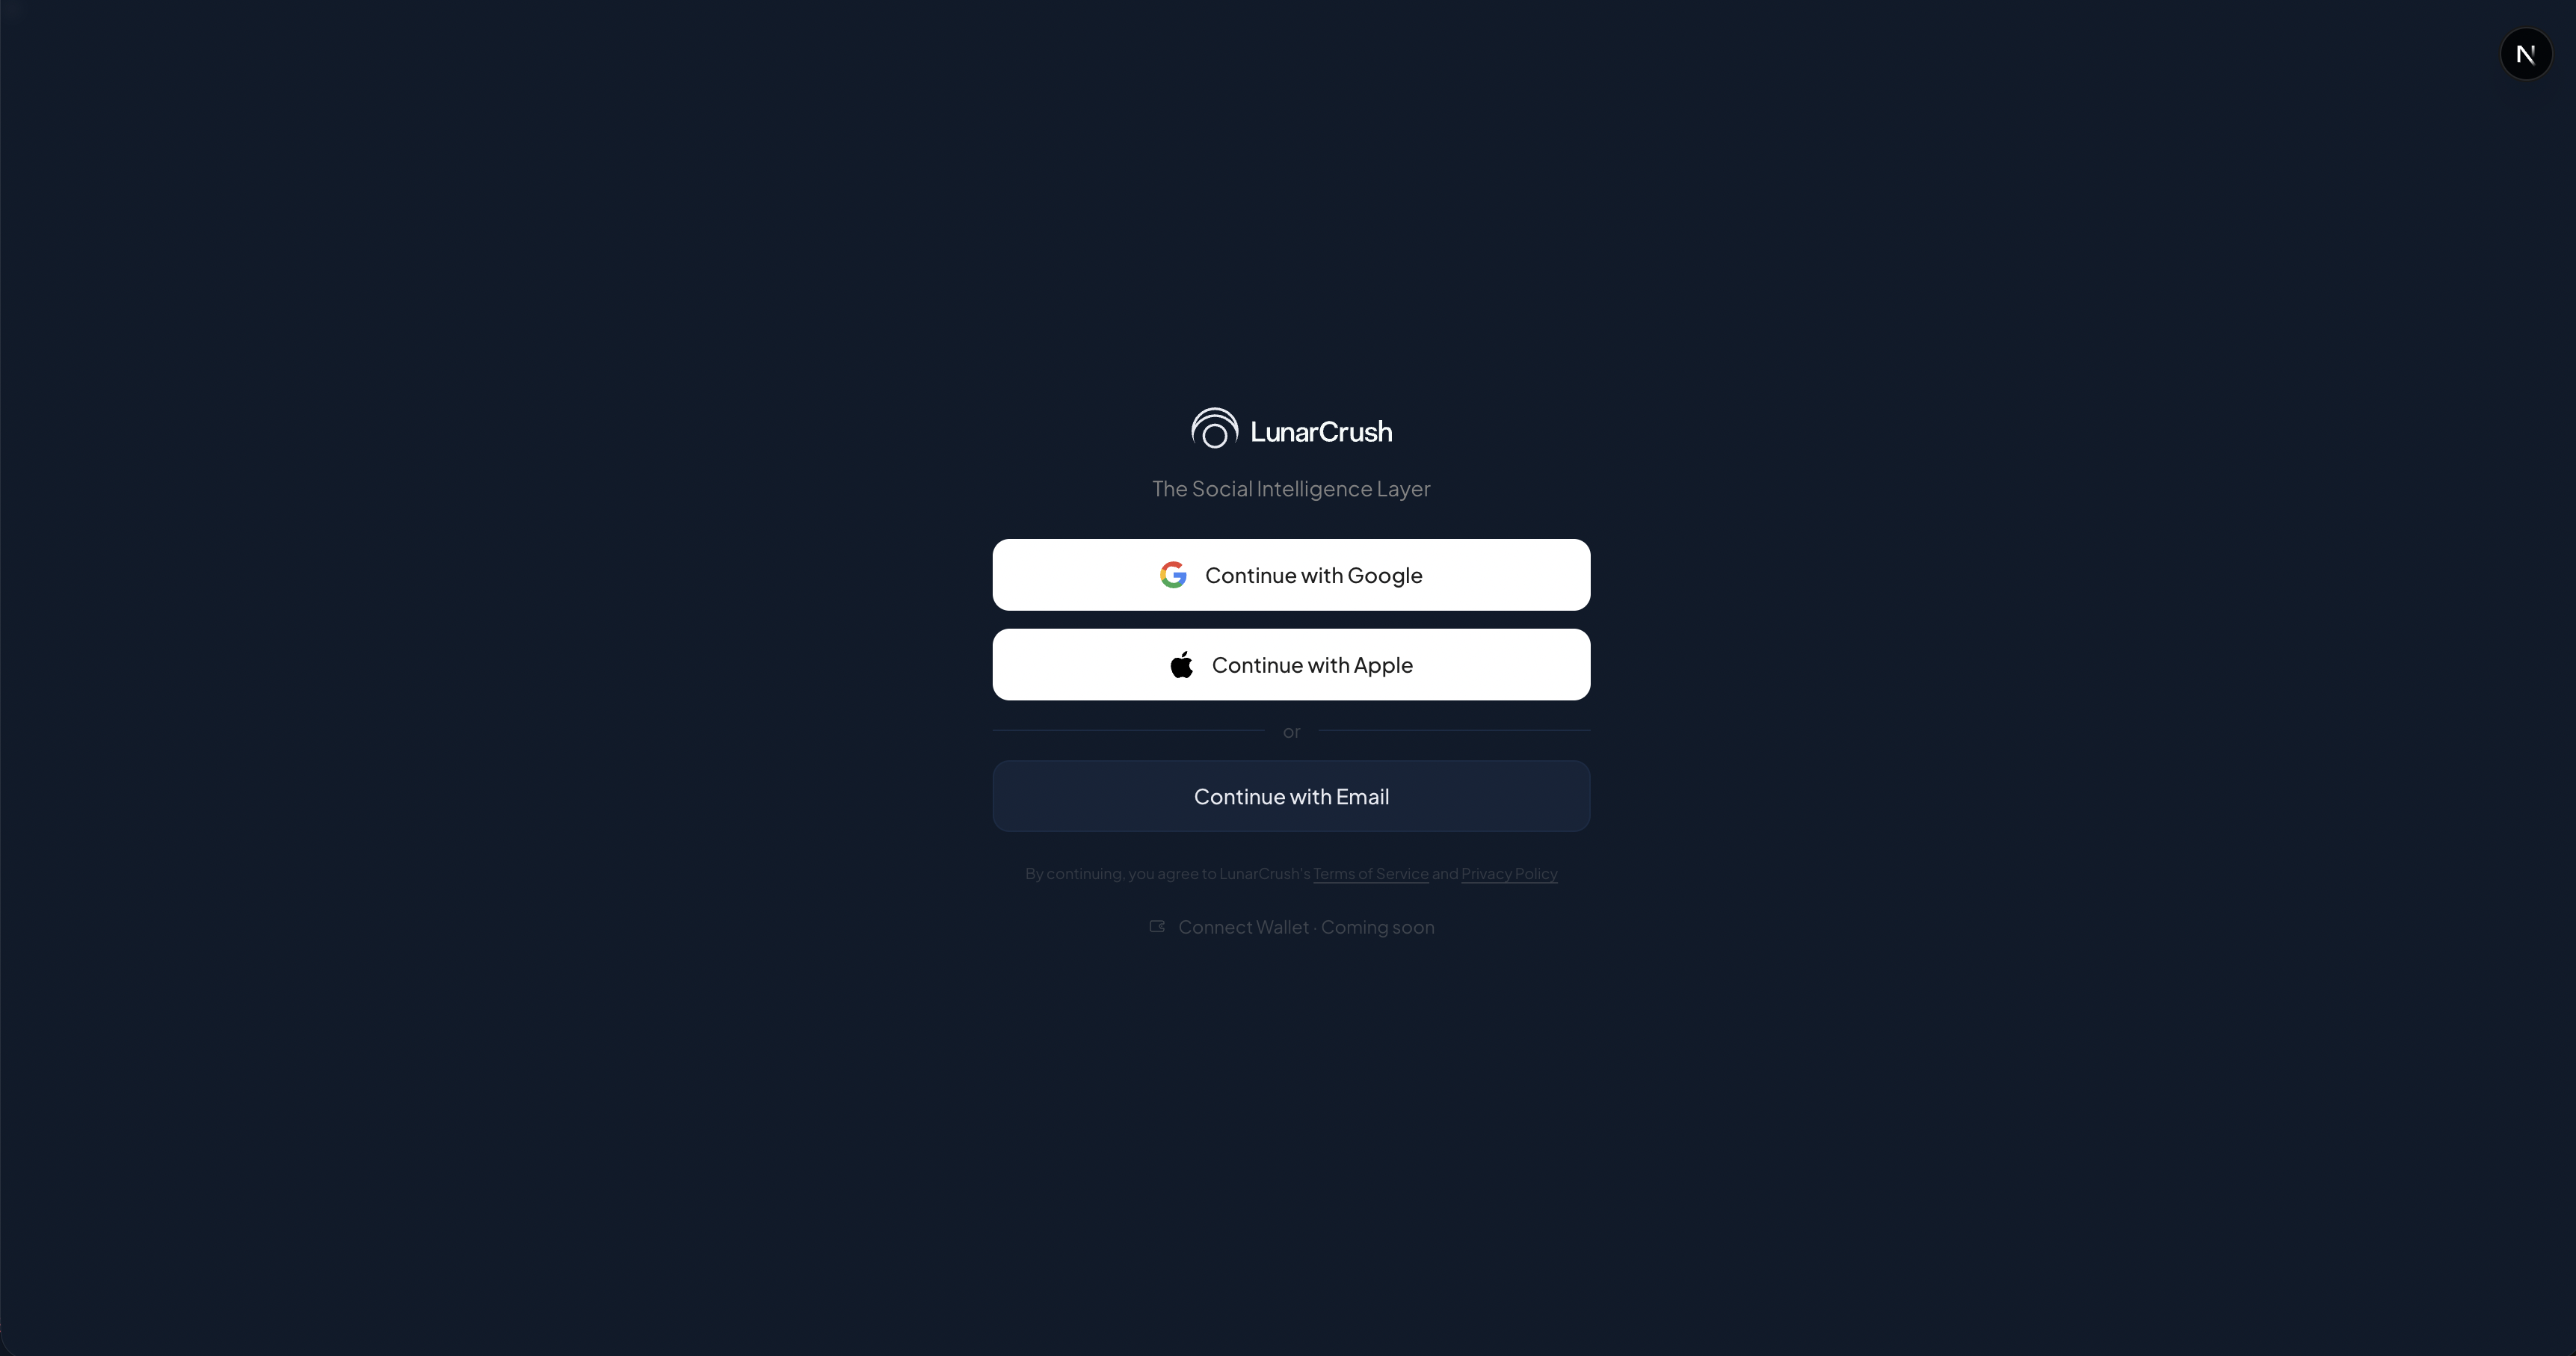
The tagline, "The Social Intelligence Layer," took about 6 rounds of copy iteration with Jon to land. We tried longer ("Understand markets through the social conversation around them"), shorter ("Social signal for markets"), and several variations between. We landed where we did because it positions the product as a layer (something that travels with the user across surfaces) rather than a destination. That framing turns out to matter for everything else in the rebuild.
Three sign-in paths today: Google, Apple, and email. A fourth, a wallet-based sign-in for the crypto-native segment, is in flight. The frontend is ready and disabled until the backend exposes the new auth endpoint we have specced.
Onboarding
After sign-up, the user picks a few categories of interest, then a few topics inside those categories. The picks shape what they see when they land in the app.
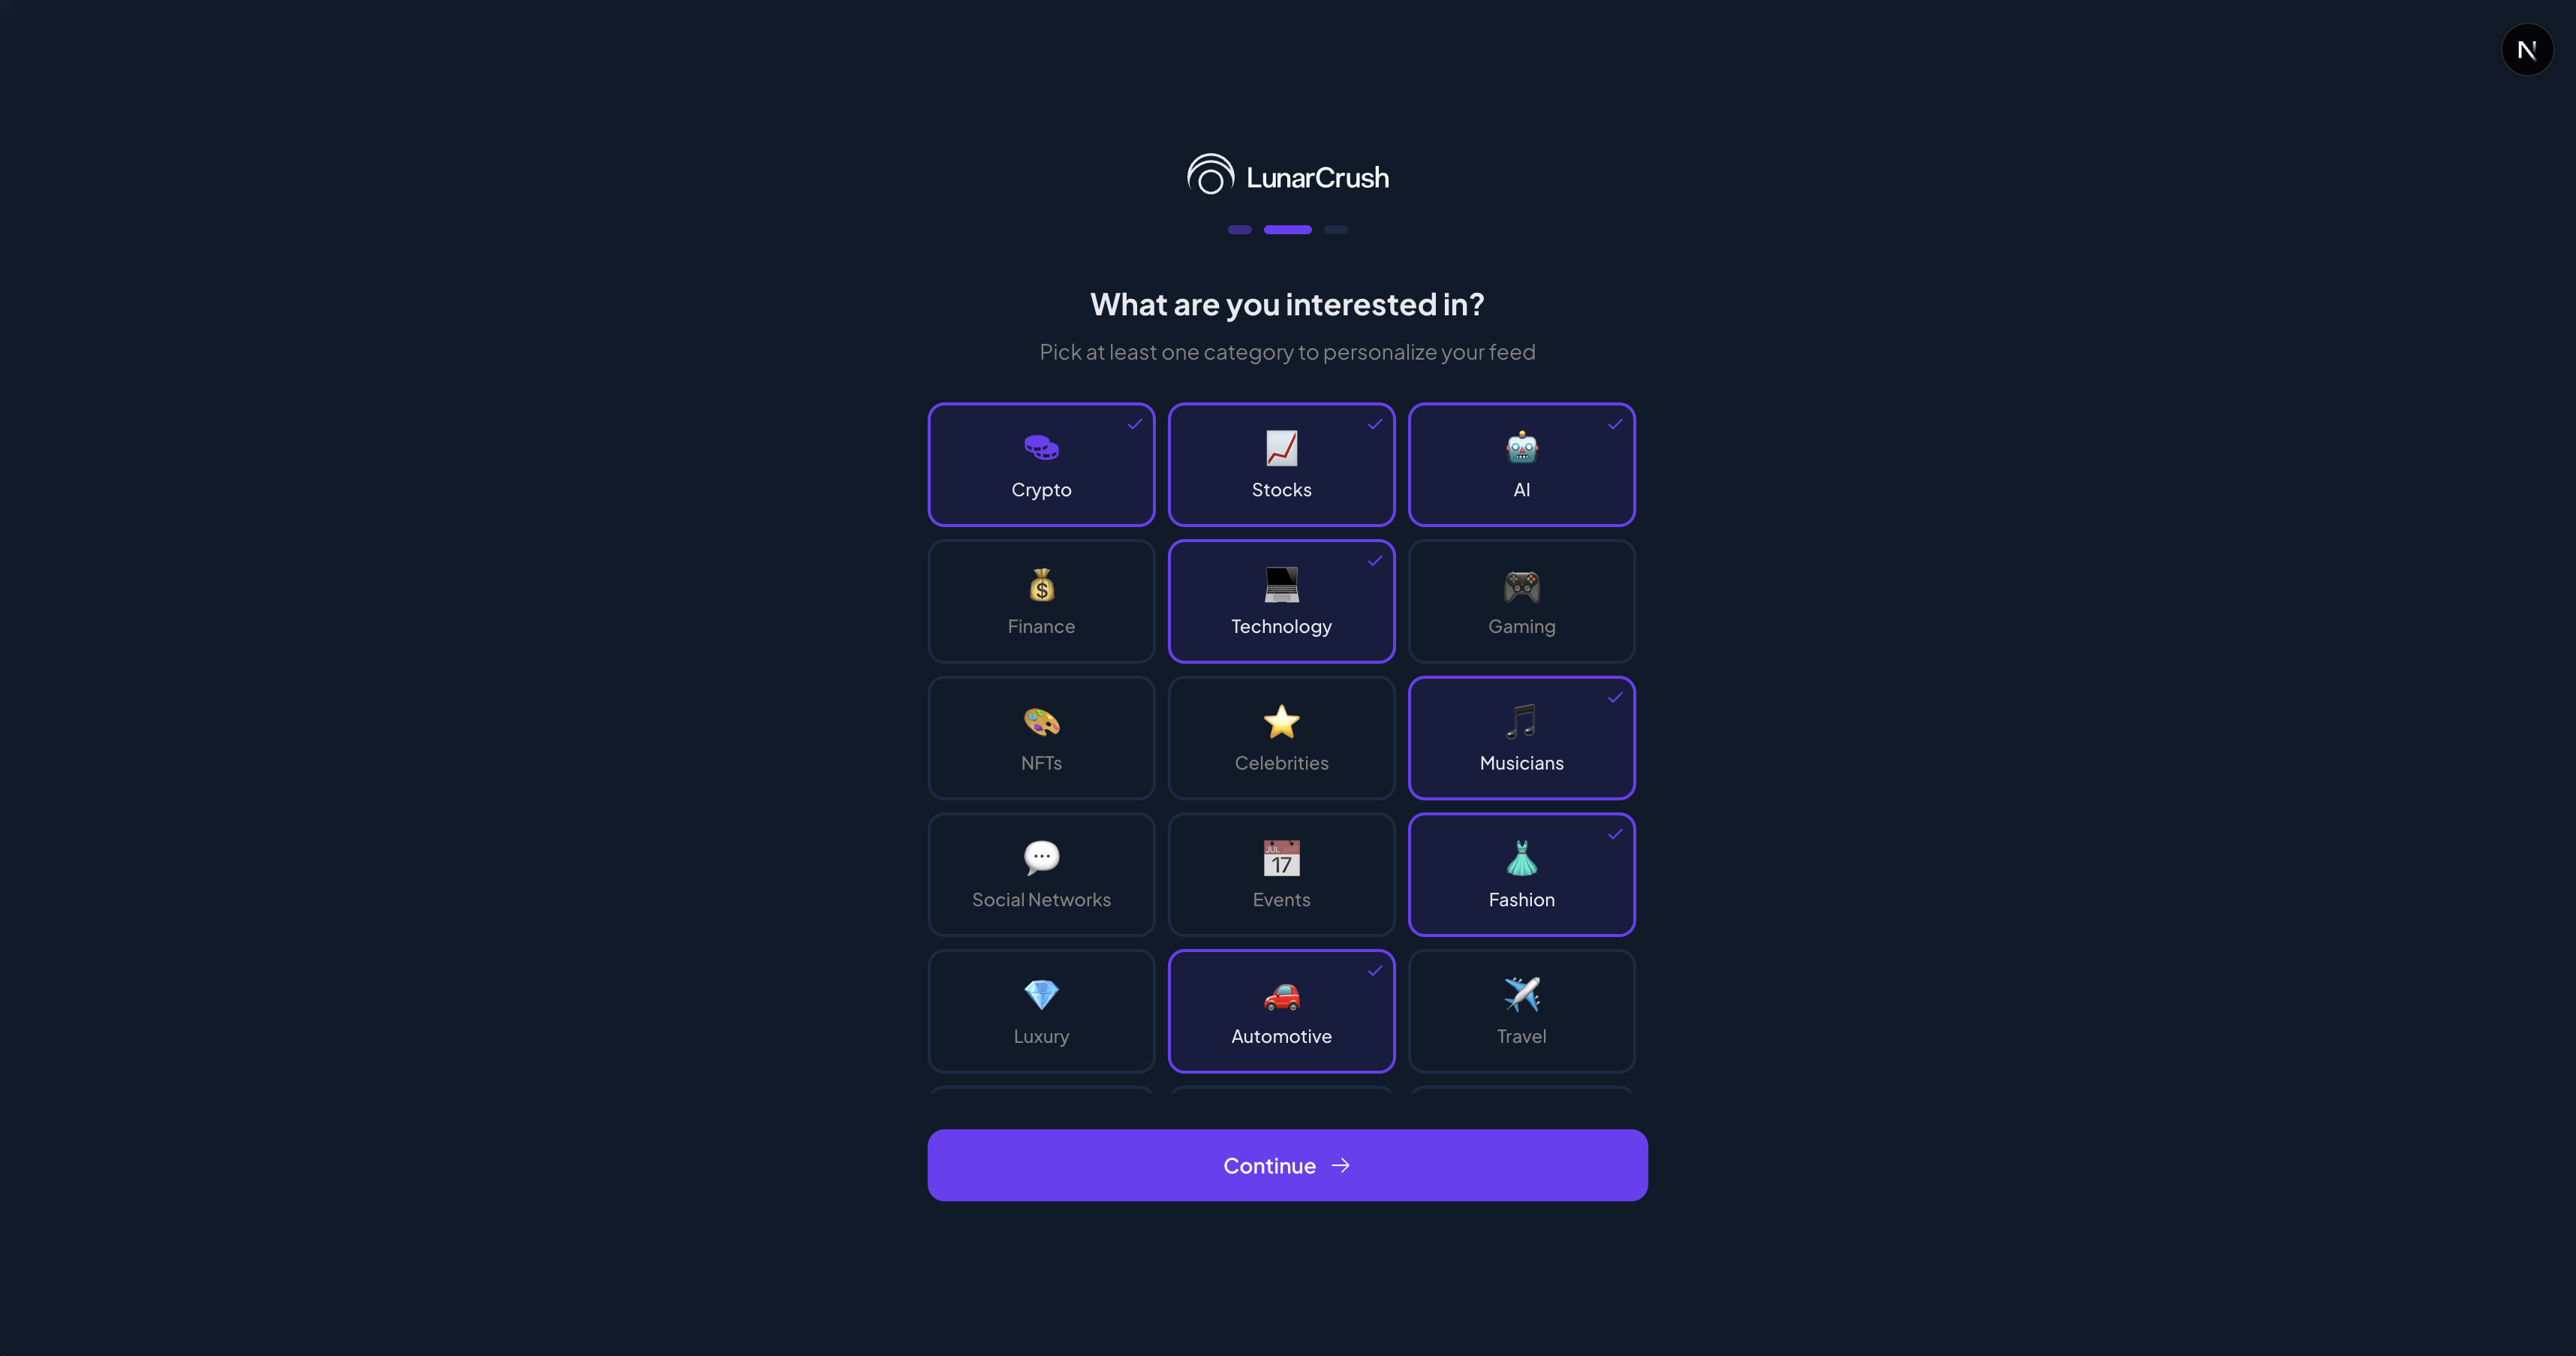
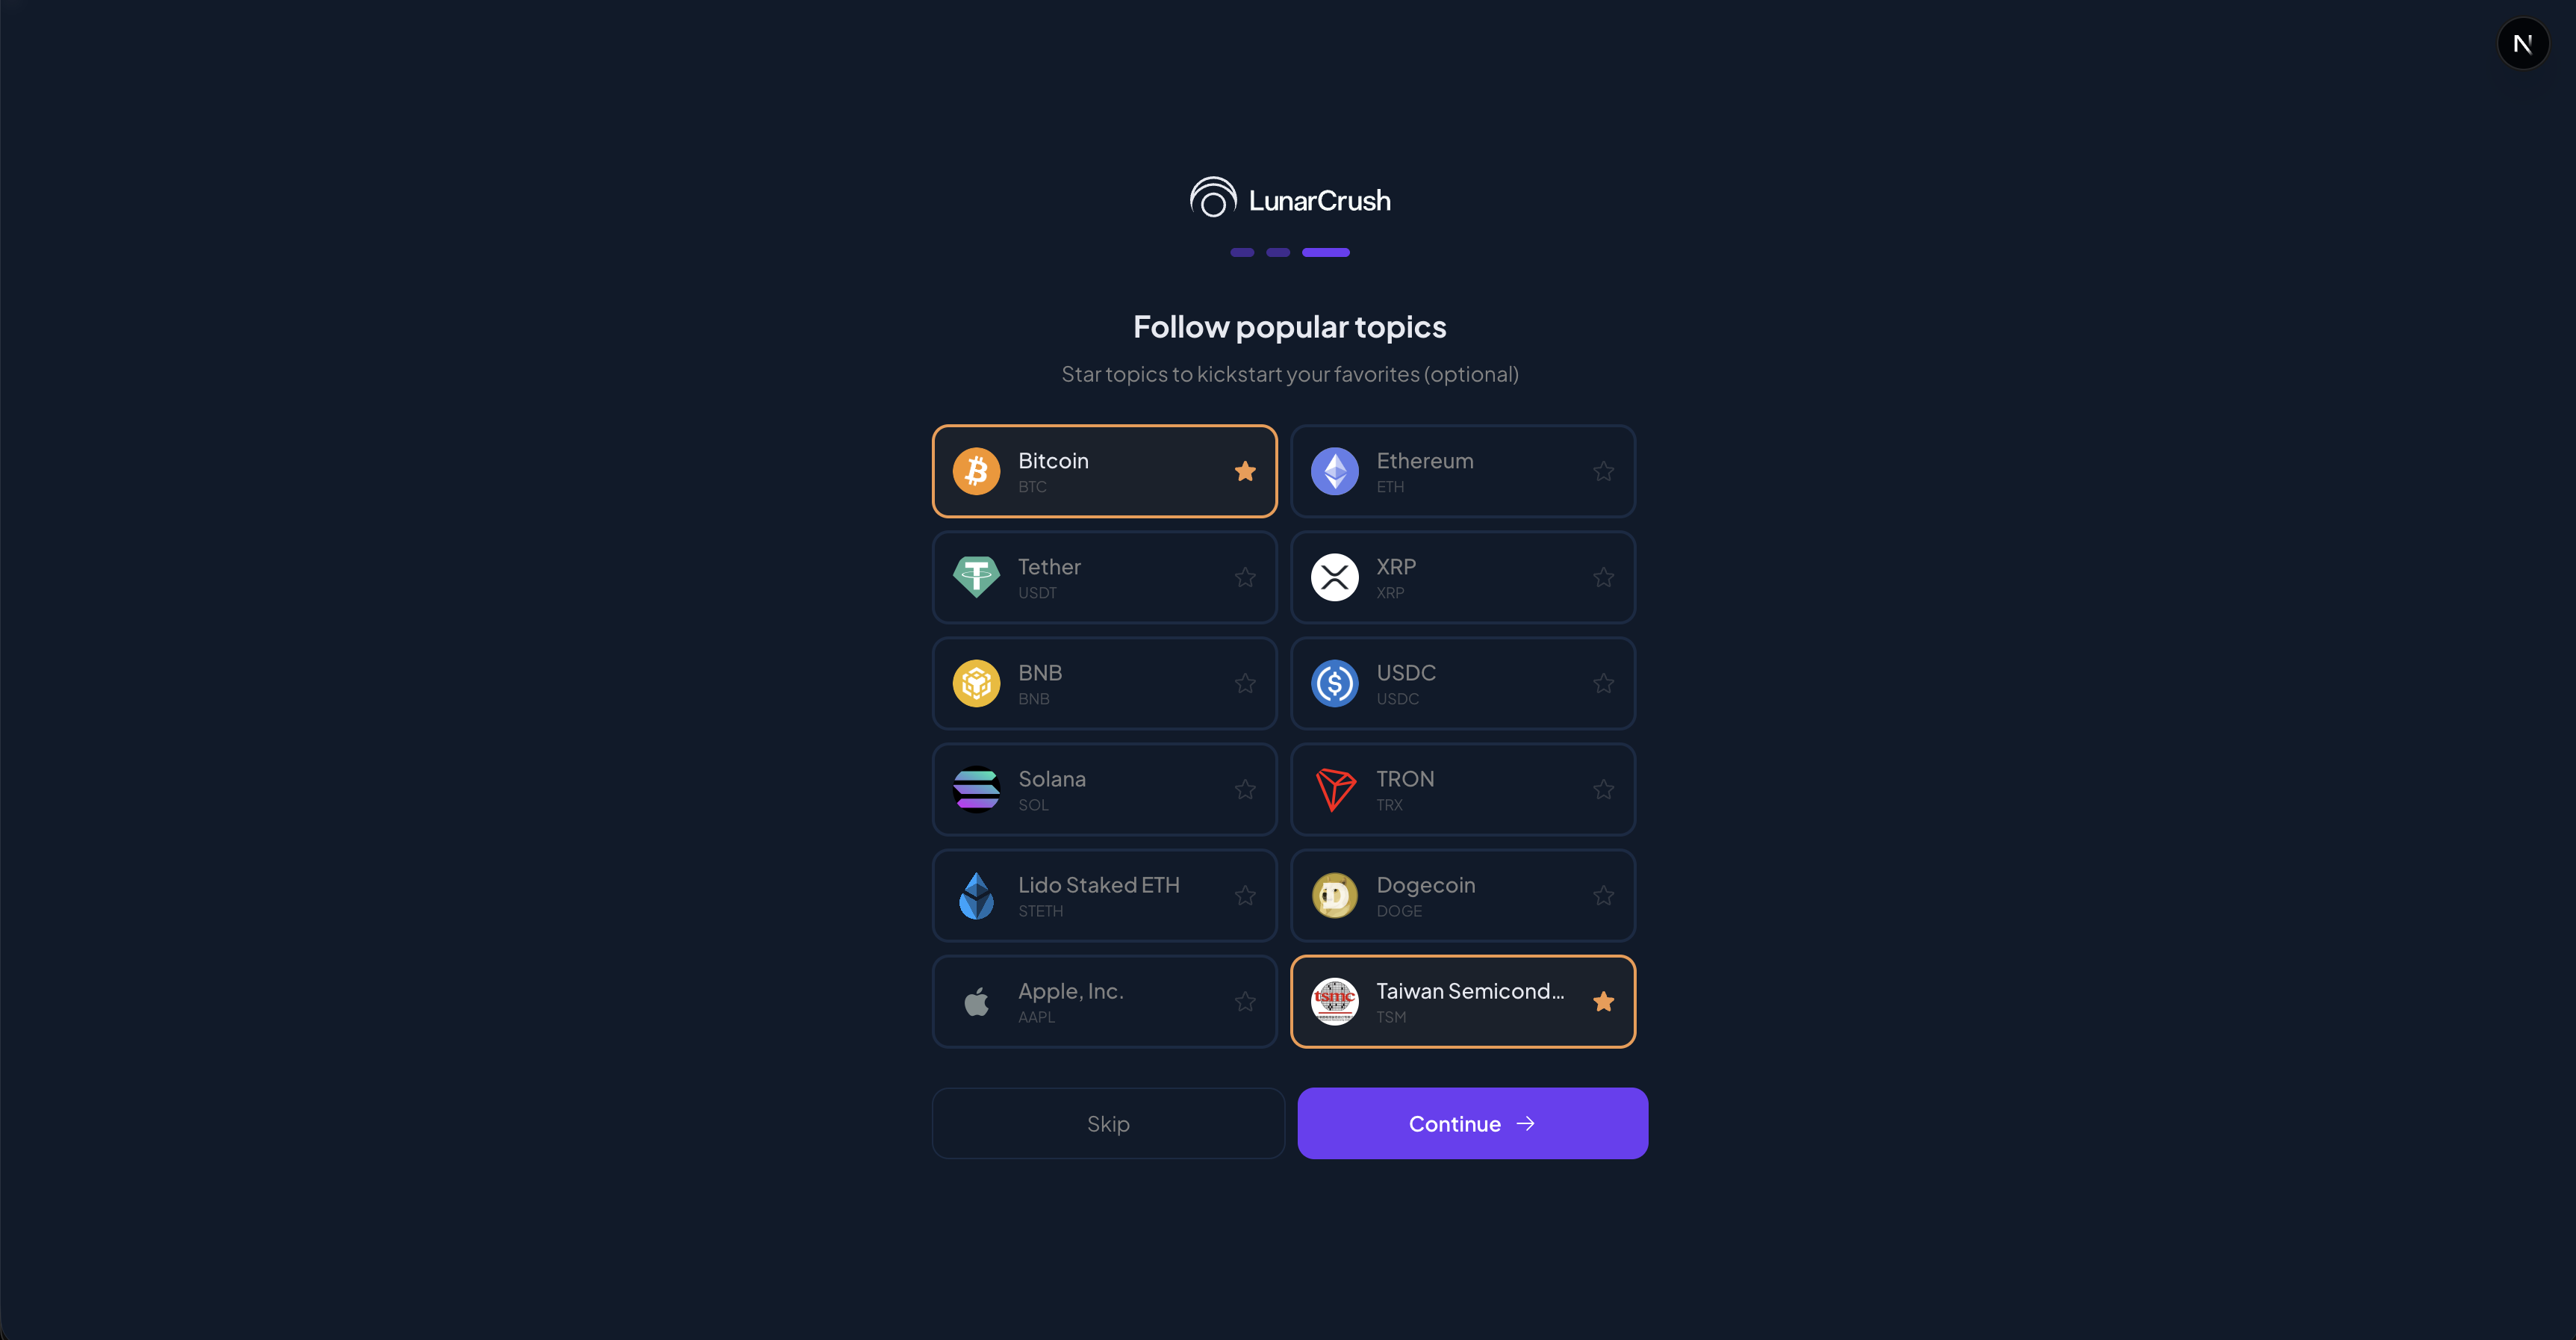
Onboarding had a bug Jon caught and reported in late April. He had picked Luxury, Automotive, and Travel as his categories, and the home screen was still showing him crypto content. The favorites panel and the tab bar respected his picks; the home composition itself did not. The fix turned out to live in three places at once: the home composition, the user-interest signal hook, and the default-category fallback that kicked in before the picks loaded. We closed it inside a day and the rule went into the architecture: the home screen scopes everything to the user's selections, every time, with no defaults that can leak across category boundaries.
Discover, the workspace shell
After sign-in the user lands on Discover. This is the shell that holds the rest of the app: a left rail with personal context, a center stage that adapts to what the user is doing, a right panel called Snapshot for AI-authored narratives, and a top nav for category switching.
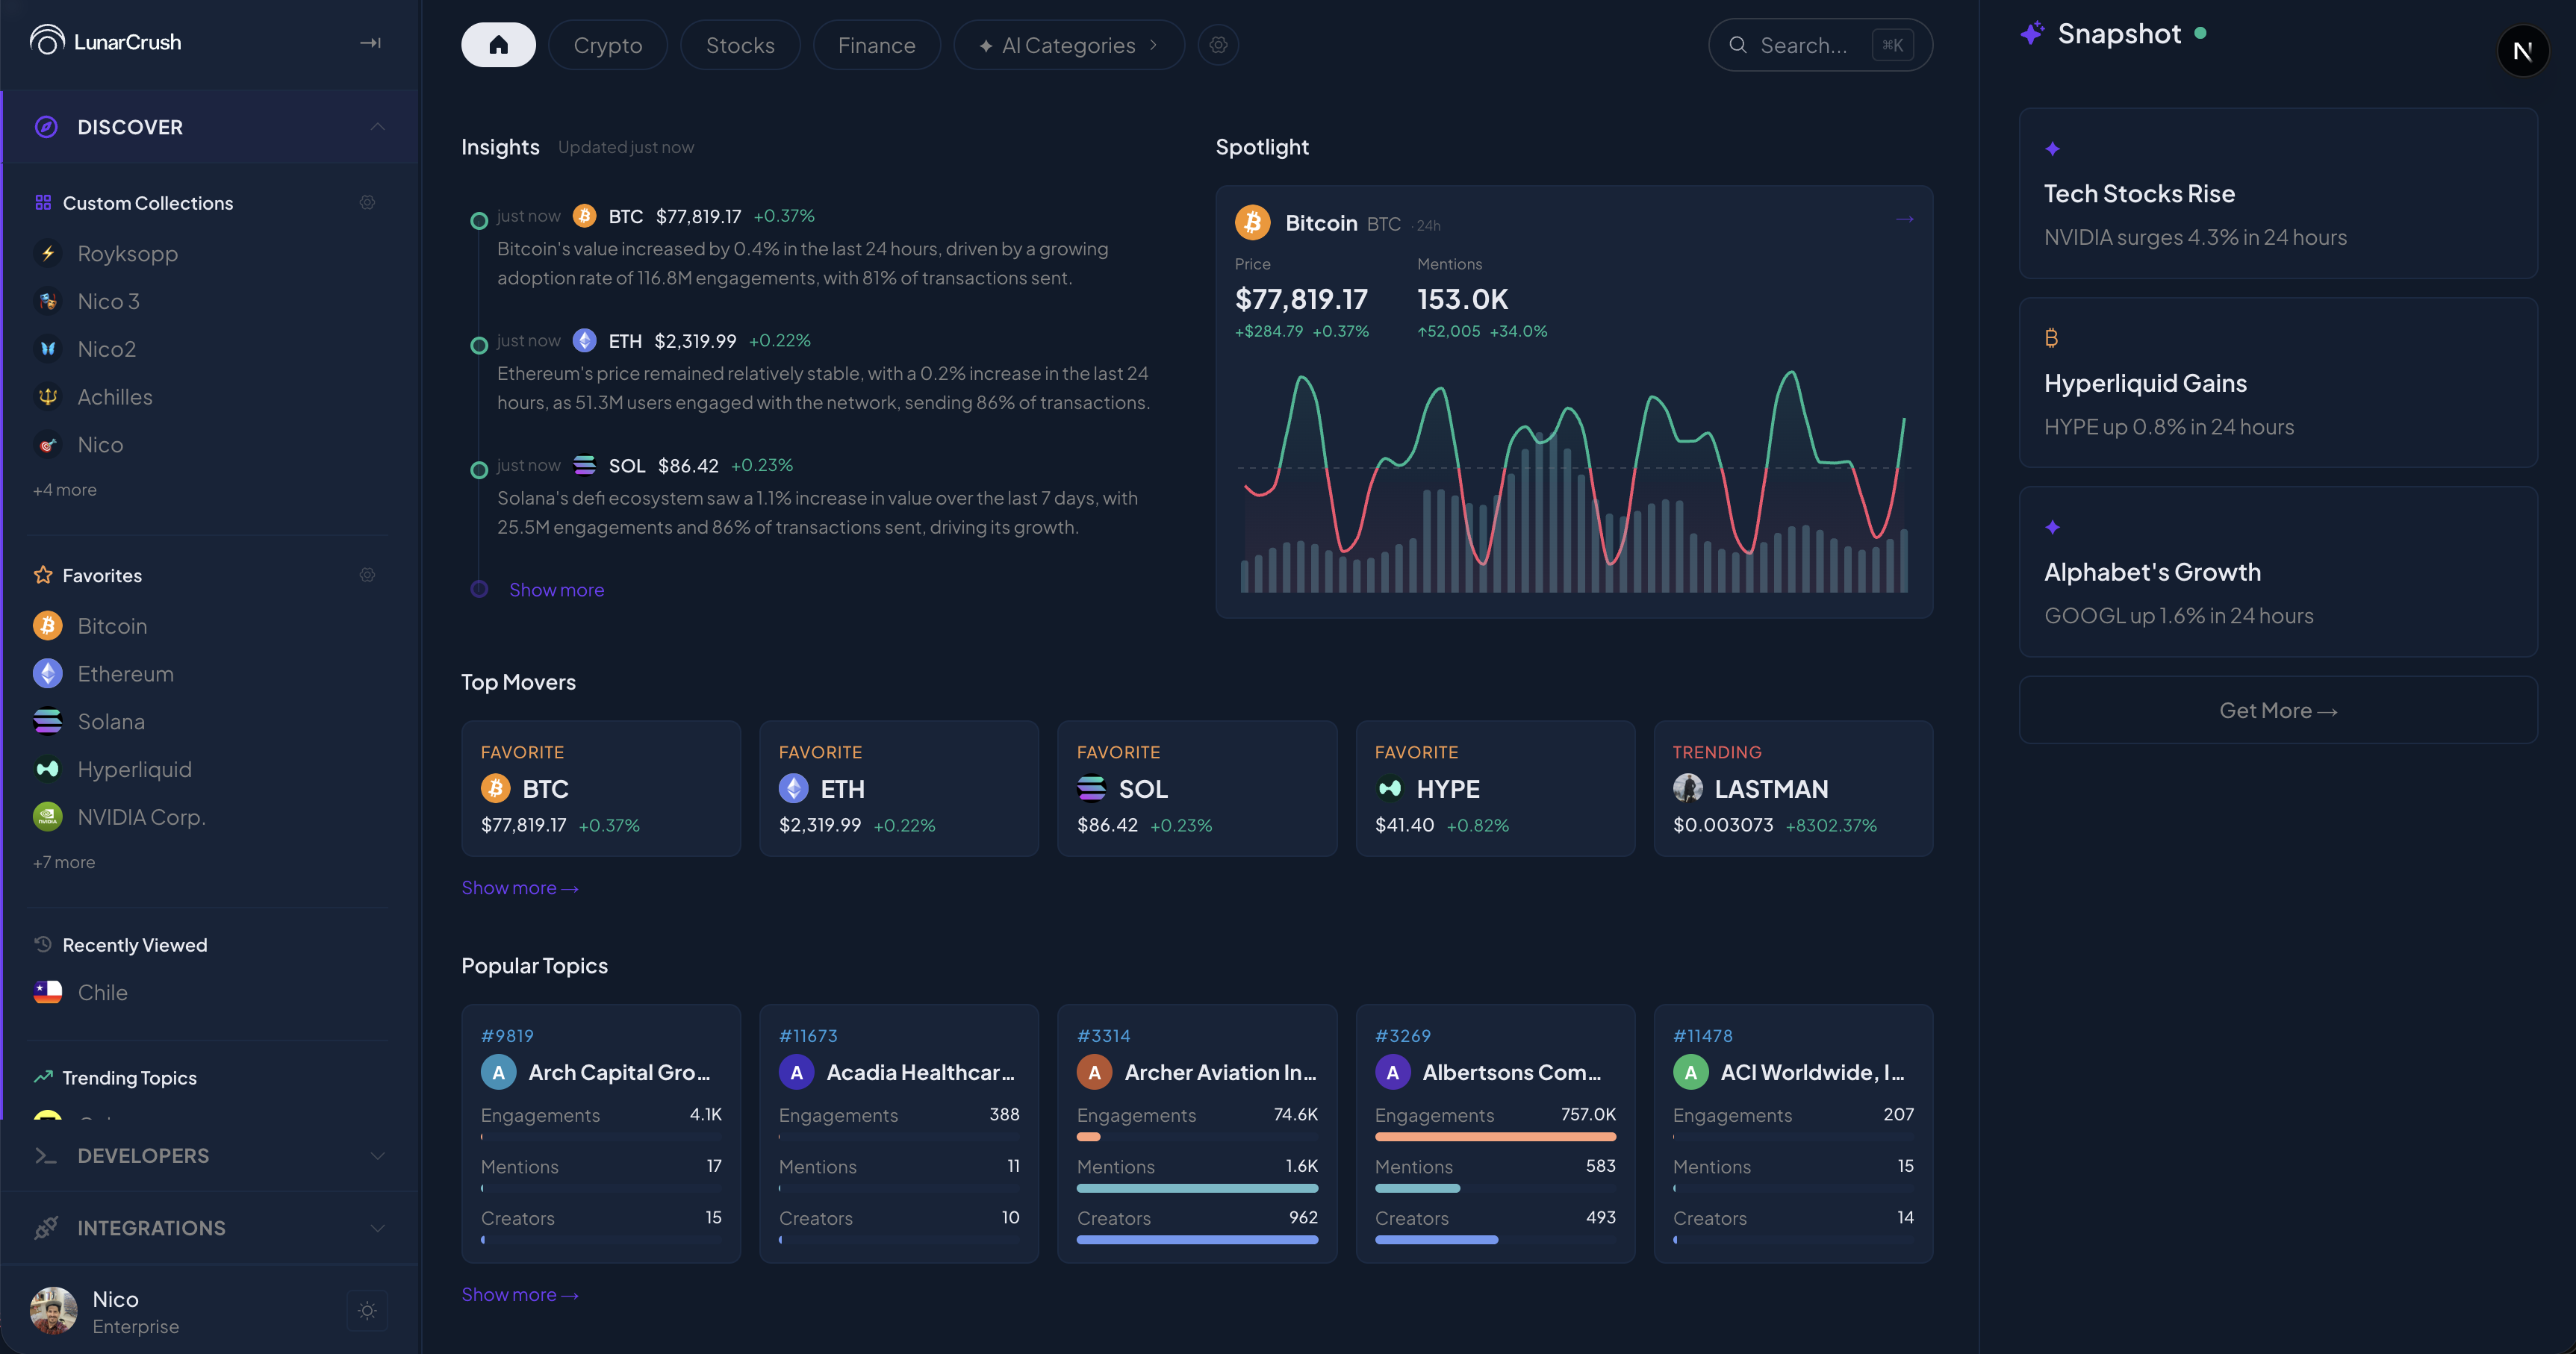
Most of what is visible in this single render is the result of weeks of working sessions.
The left rail leads with Custom Collections, the user's own bundles of topics. Below that, Favorites, then Recently Viewed (auto-populated, surfacing the user's actual interest pattern without asking them to favorite anything), then Trending Topics, then Developers and Integrations as alternate routes through the same workspace.
The top nav is the category switcher: Crypto, Stocks, Routes, Finance, AI Categories. What is below the nav changes per category. The shell does not.
The center stage carries the agentic surfaces. Insights leads with a short auto-authored narrative paragraph (the example in the screenshot reads "BTC up 7.87% in 24 hours, driven by sustained accumulation of 1.5K BTC..."). Spotlight is a featured topic with a chart and a market-cap delta. Top Movers shows the user's favorites first, then trending. Popular Topics at the bottom are entry points into individual topic detail pages.
The right panel is called Snapshot. It surfaces what the AI thinks is going on right now, in three short paragraphs. In the screenshot you can see "Tech Stocks Rise. Hyperliquid Gains. Alphabet's Growth." This panel is one of the surfaces I am proudest of: it is how the user gets a glance of the social environment without having to navigate, and the layout is the result of about a month of iteration. We tried it as a feed, as cards, as a single long paragraph, and as a list of headlines. The current shape is what survived.
Categories
When the user picks a category from the top nav, the same shell renders the category overview.
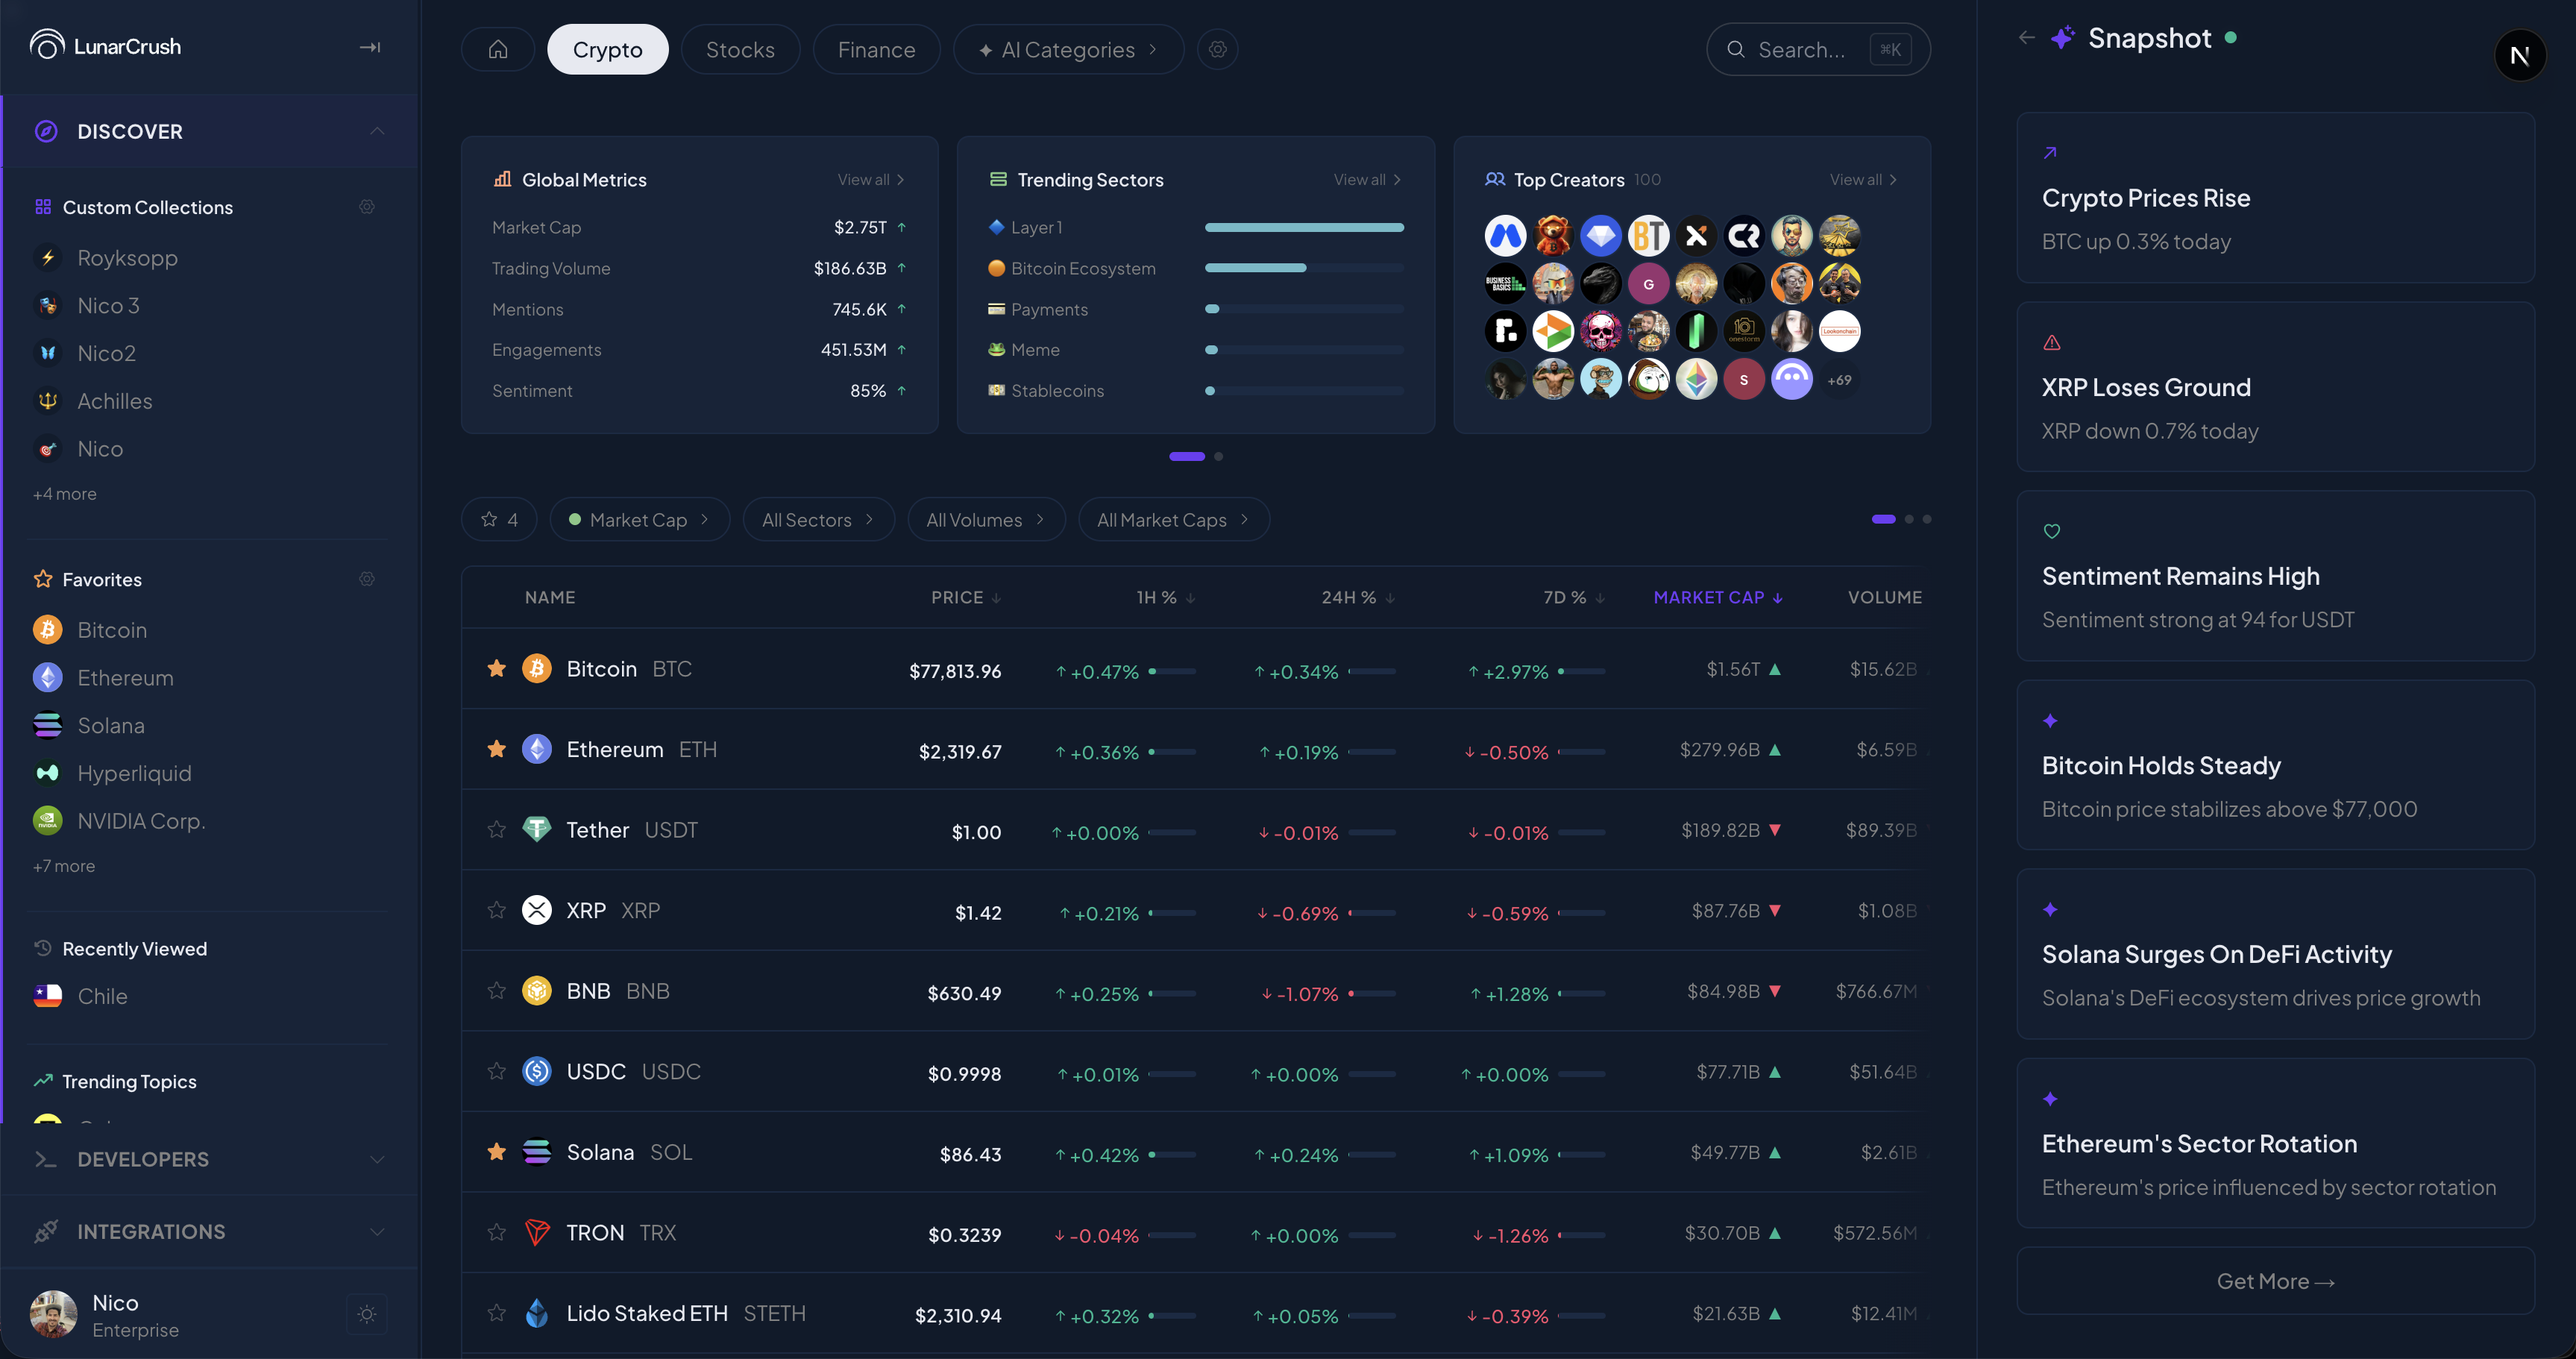
Crypto leads with Global Metrics (Market Cap $2.13T, Trading Volume $156.4B, Mentions 793.4K, Engagements 26.2M, Sentiment 9%). Trending Sectors is a horizontal bar chart showing which crypto sub-sectors are getting the most attention. Top Creators is a grid of the most influential voices in the category. Below all of it is the sortable, filterable asset table (Bitcoin, Ethereum, Tether, XRP, BNB, USDC, Solana, TRON, Lido Staked ETH) with columns the user can configure.
The same shell renders Stocks.
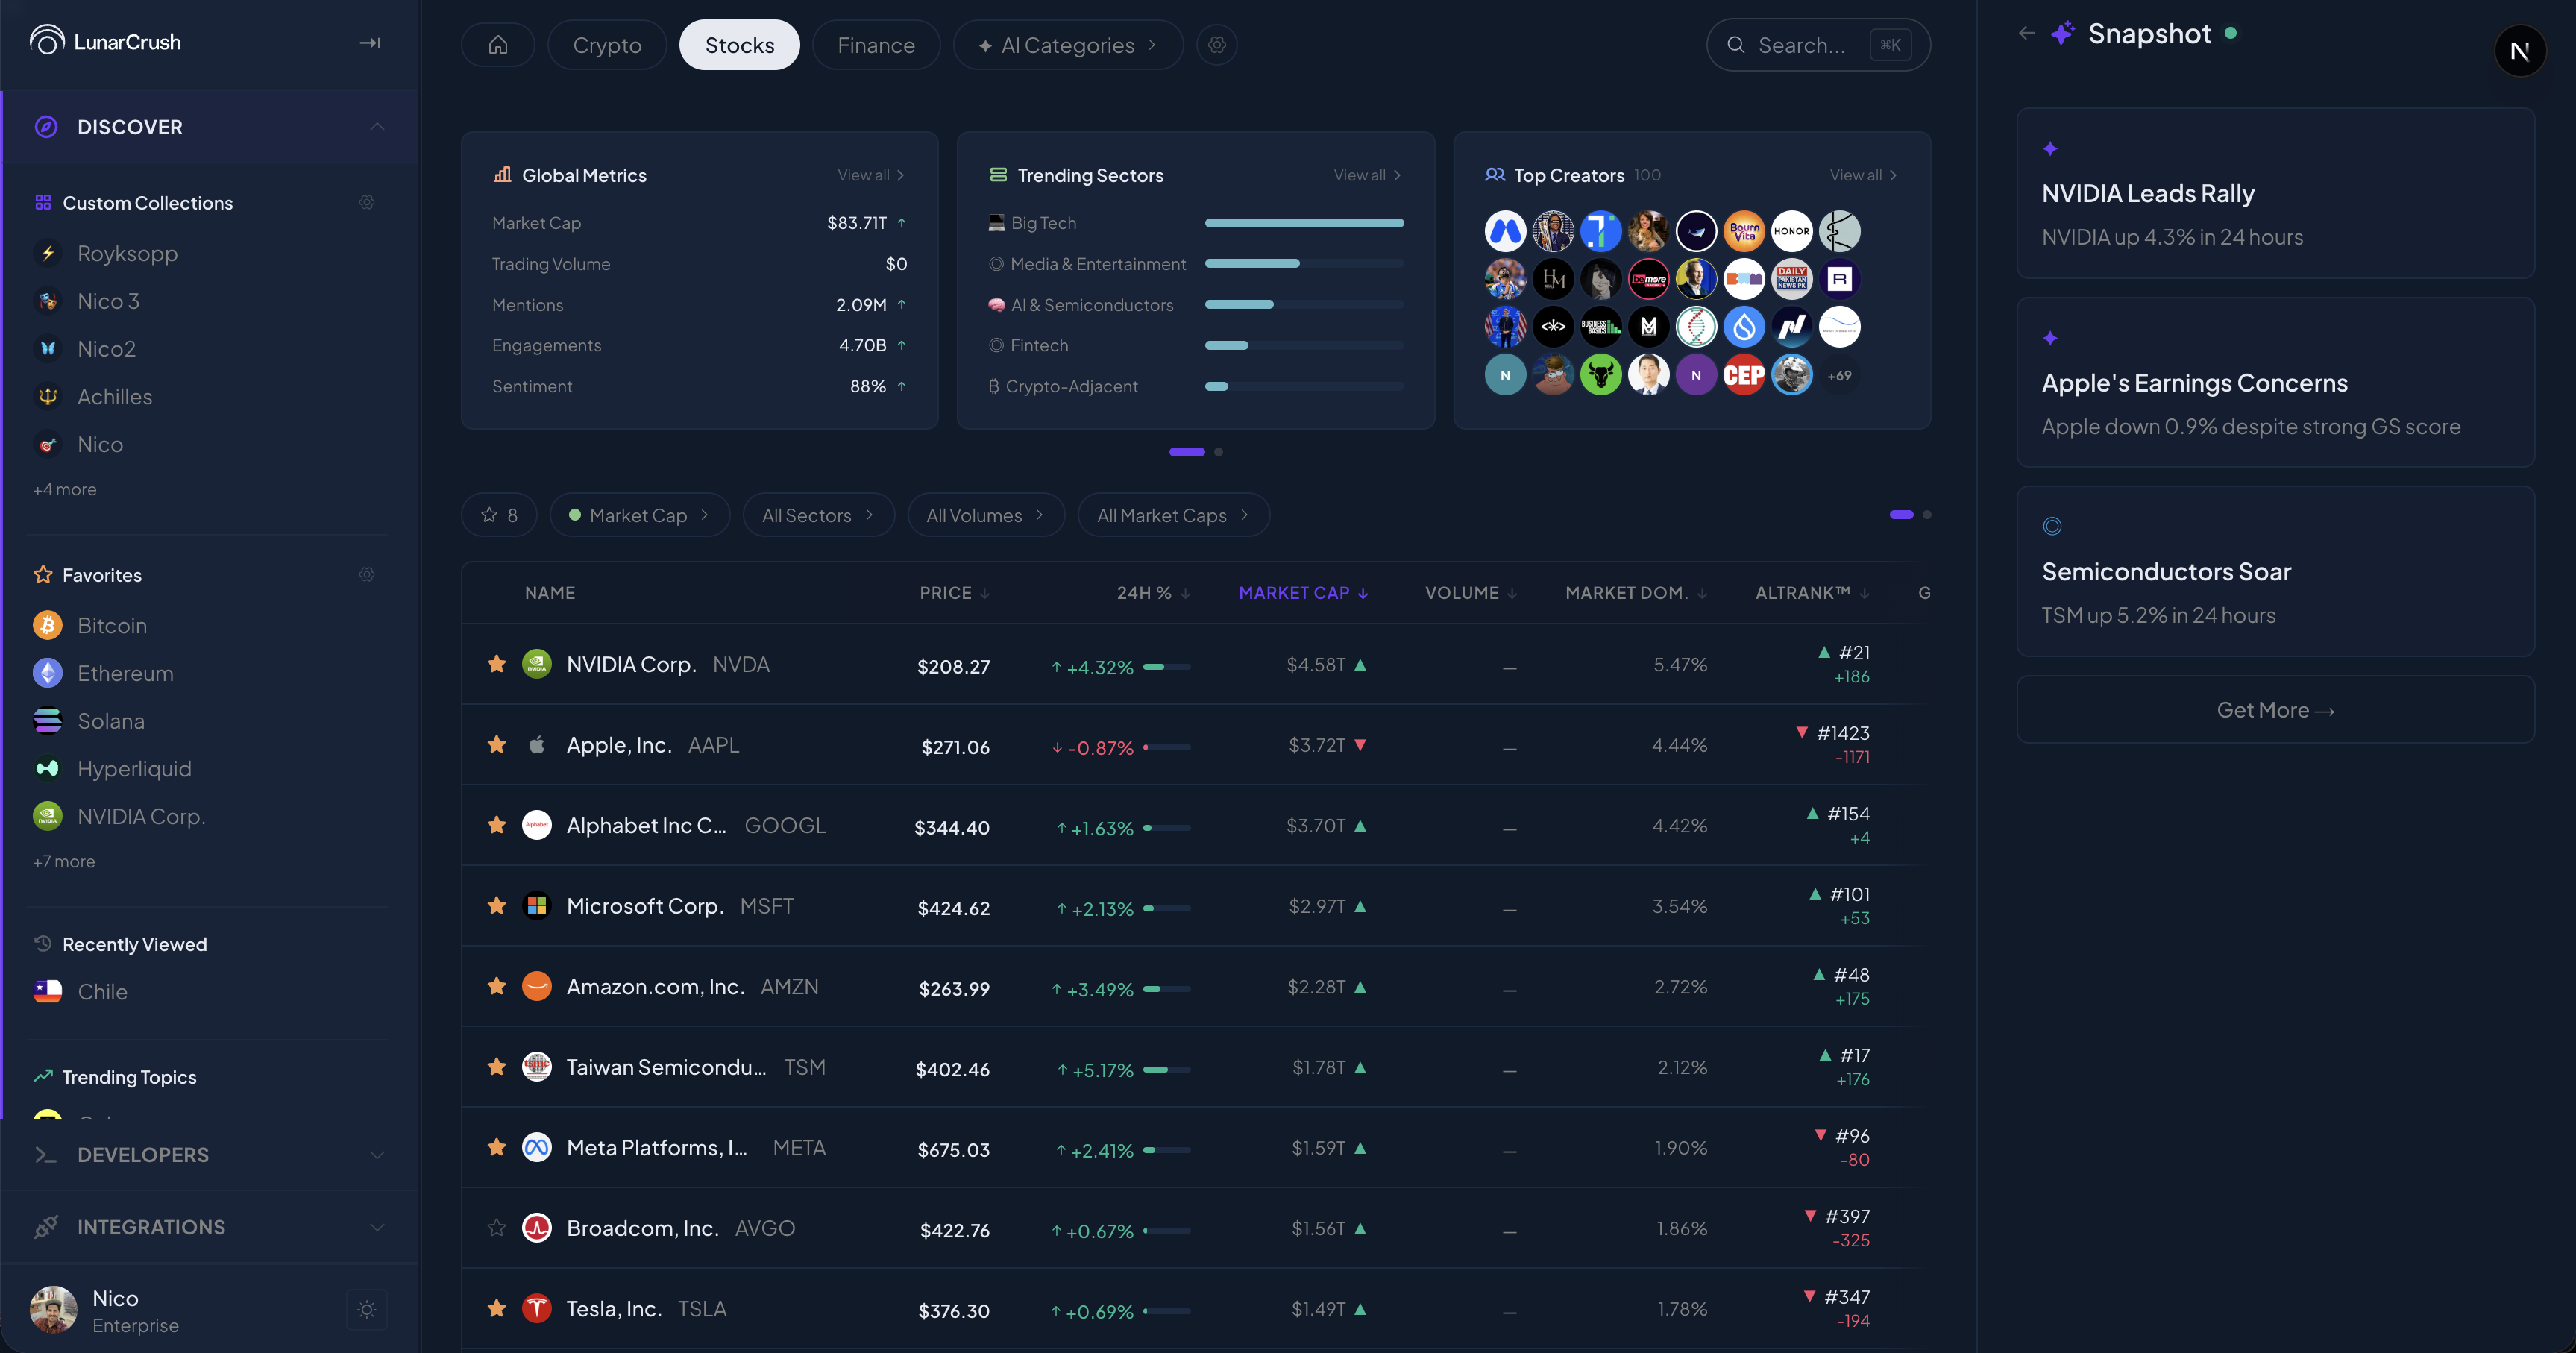
Snapshot shifts to "NVIDIA Leads Rally / Apple's Earnings Concerns / Semiconductors Soar." The Trending Sectors bars rename to Top Tech, Pharma & Biotech, Auto & Mobility, Banking & Financial. Global Metrics swaps to S&P 500 / Trading Volume / Mentions / Engagements. The asset table now renders NVIDIA, Apple, Alphabet, Microsoft, Amazon, Meta, Broadcom, Tesla.
This is the test of the architecture. Coins and stocks are very different things: different price scales, different metrics, different audiences. If a single shell can render both without feeling cramped on one side and empty on the other, the shell is real. We have also rendered Routes, Finance, AI Categories, NFL, NBA, NHL, PGA, Prediction Markets, Countries, Celebrities, and several brand verticals through the same shell.
A few of the iterations along the way that mattered. We replaced the old Trending Topics card with what we now call Narratives (clusters of related topics that aggregate up) because the Trending Topics list was already covered elsewhere on the site and was not earning its space. We added a volume gate to Top Movers so that anyone could no longer pump a memecoin into the panel by trading 5,000 against themselves. We unified the Global Metrics arrows and the Trending Sectors bar layout in a single pass that touched 8 components and looked invisible at the end.
Topic detail
Inside any category, clicking through to an asset opens its topic page. This is the surface most users spend most of their time on.
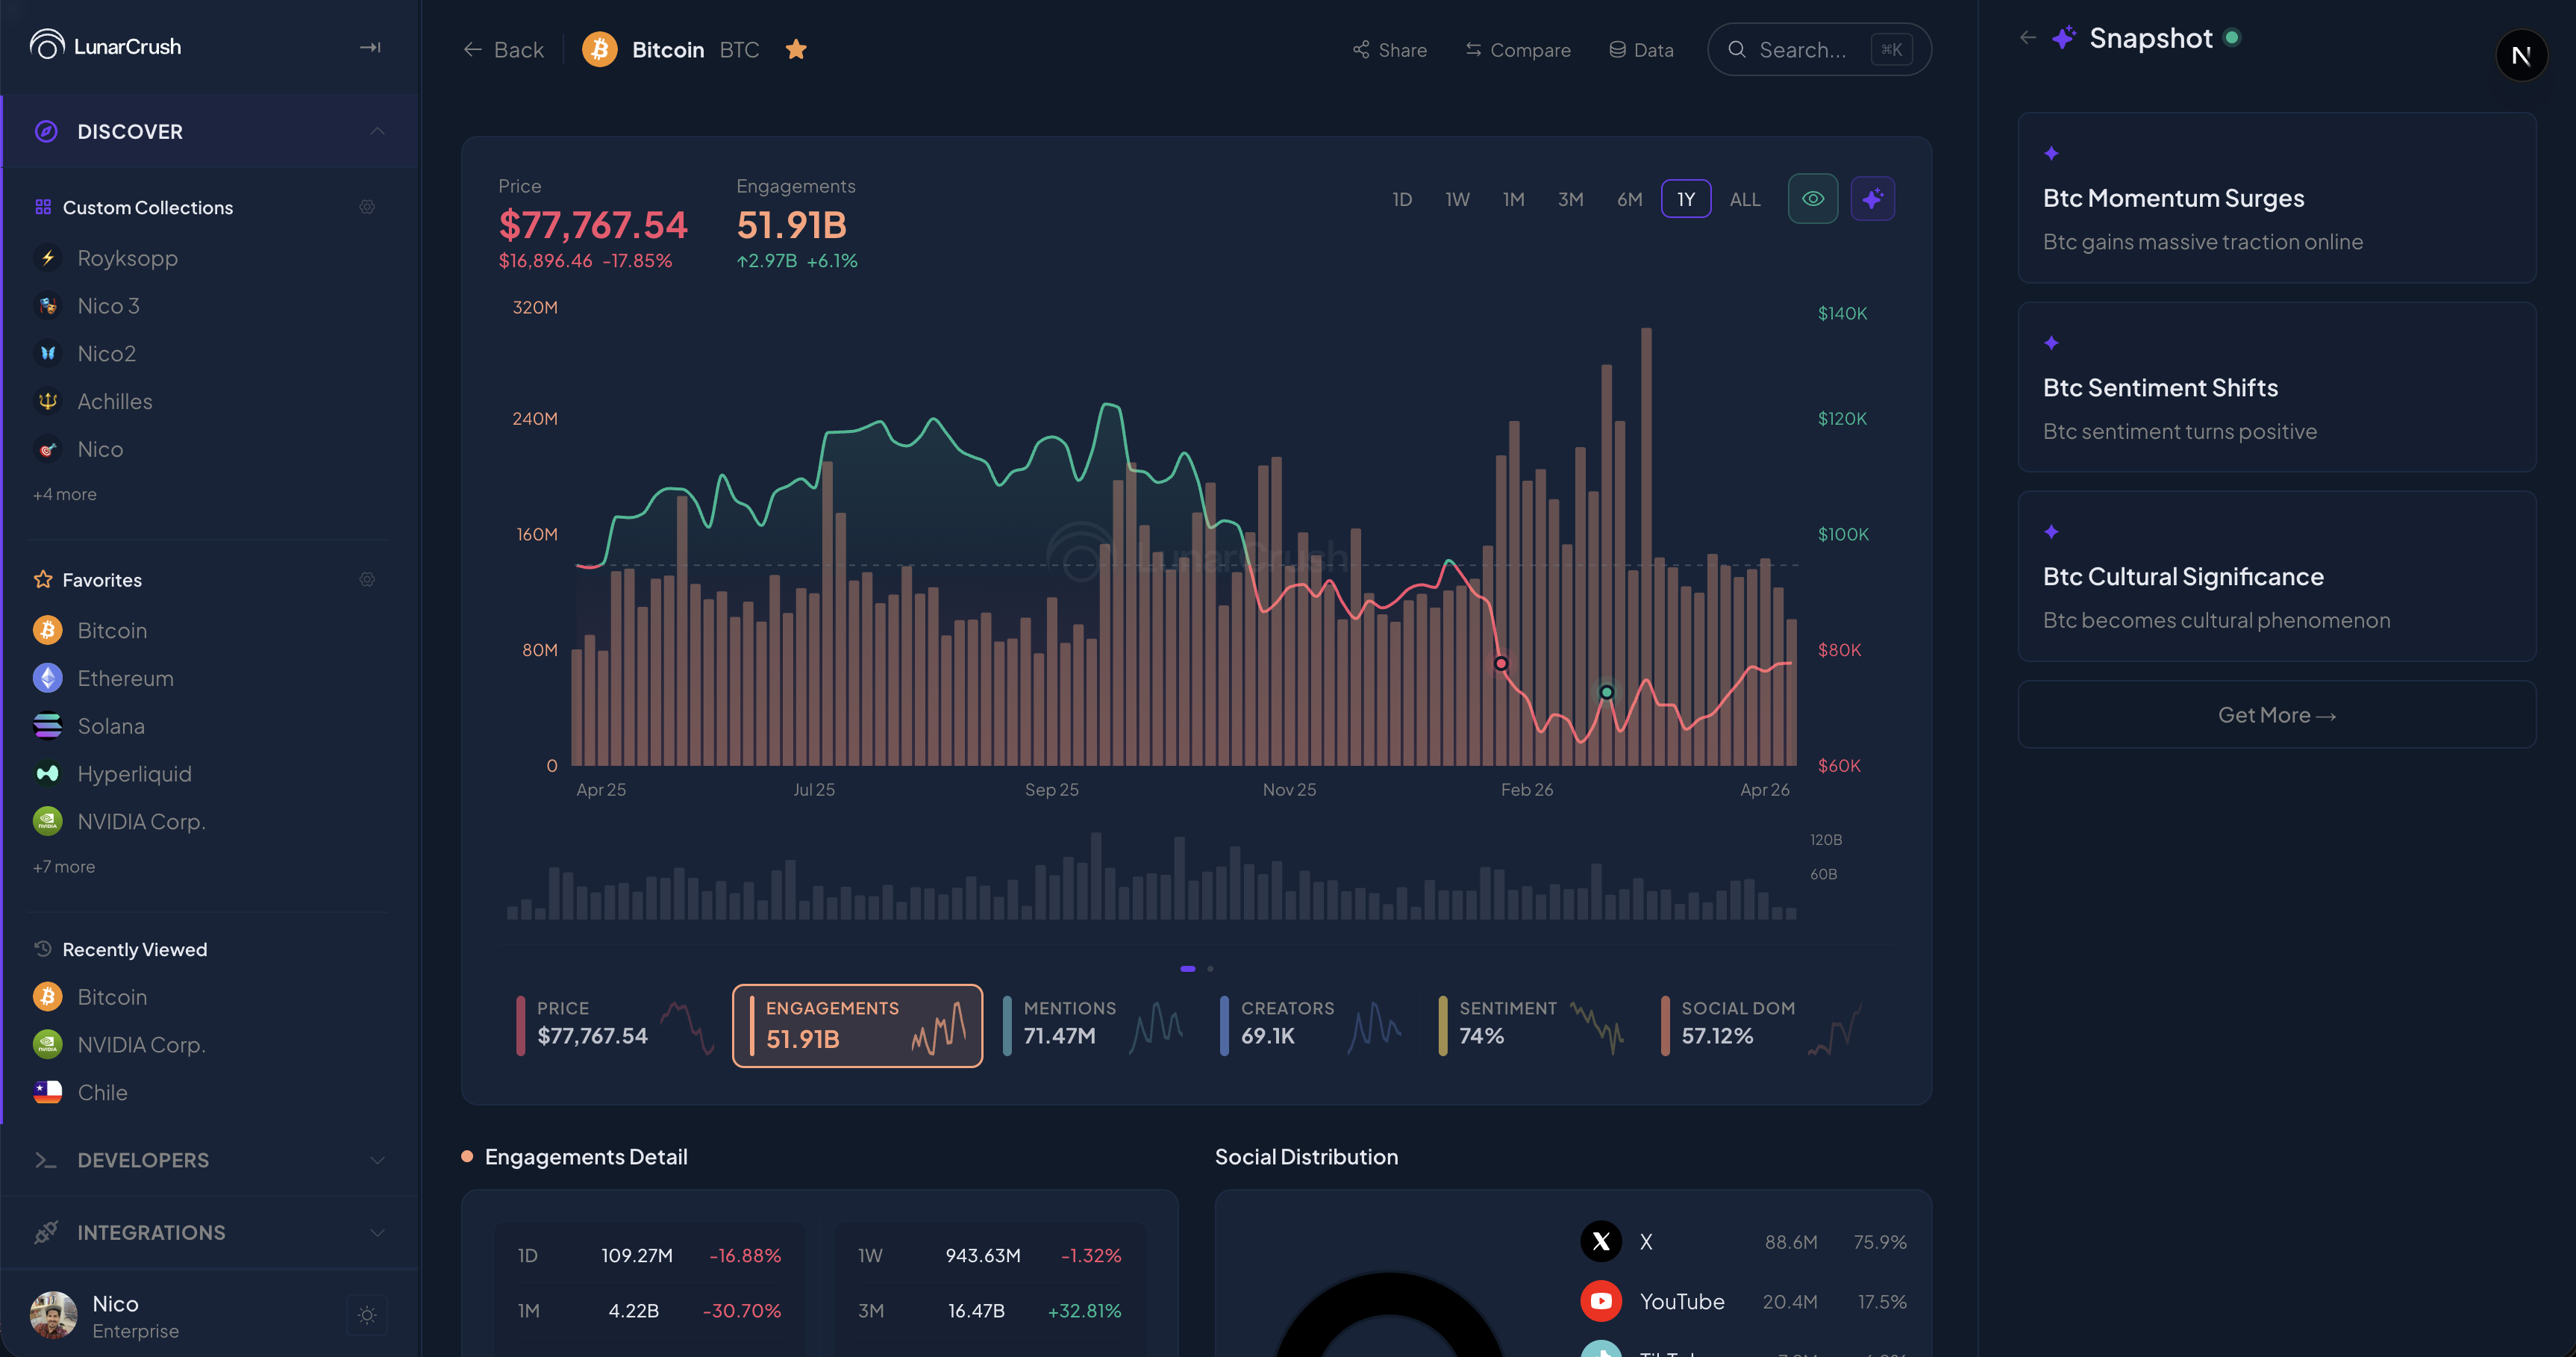
The header carries Bitcoin's price, the 24-hour change, the engagements over the period, and the interval pills (1H, 4H, 24H, 7D, 30D, 1Y, ALL). The center stage is a price-and-volume chart with engagement overlay: the price line in cream, the engagement gradient in green-blue. Below the chart, a row of metric tiles. Below them, Engagements Detail and Social Distribution. Snapshot on the right surfaces what the AI thinks is going on right now: Bitcoin Momentum Surges, Bitcoin Sentiment Shifts, Bitcoin Cultural Significance, with a paragraph under each.
The same primitive holds for stocks.
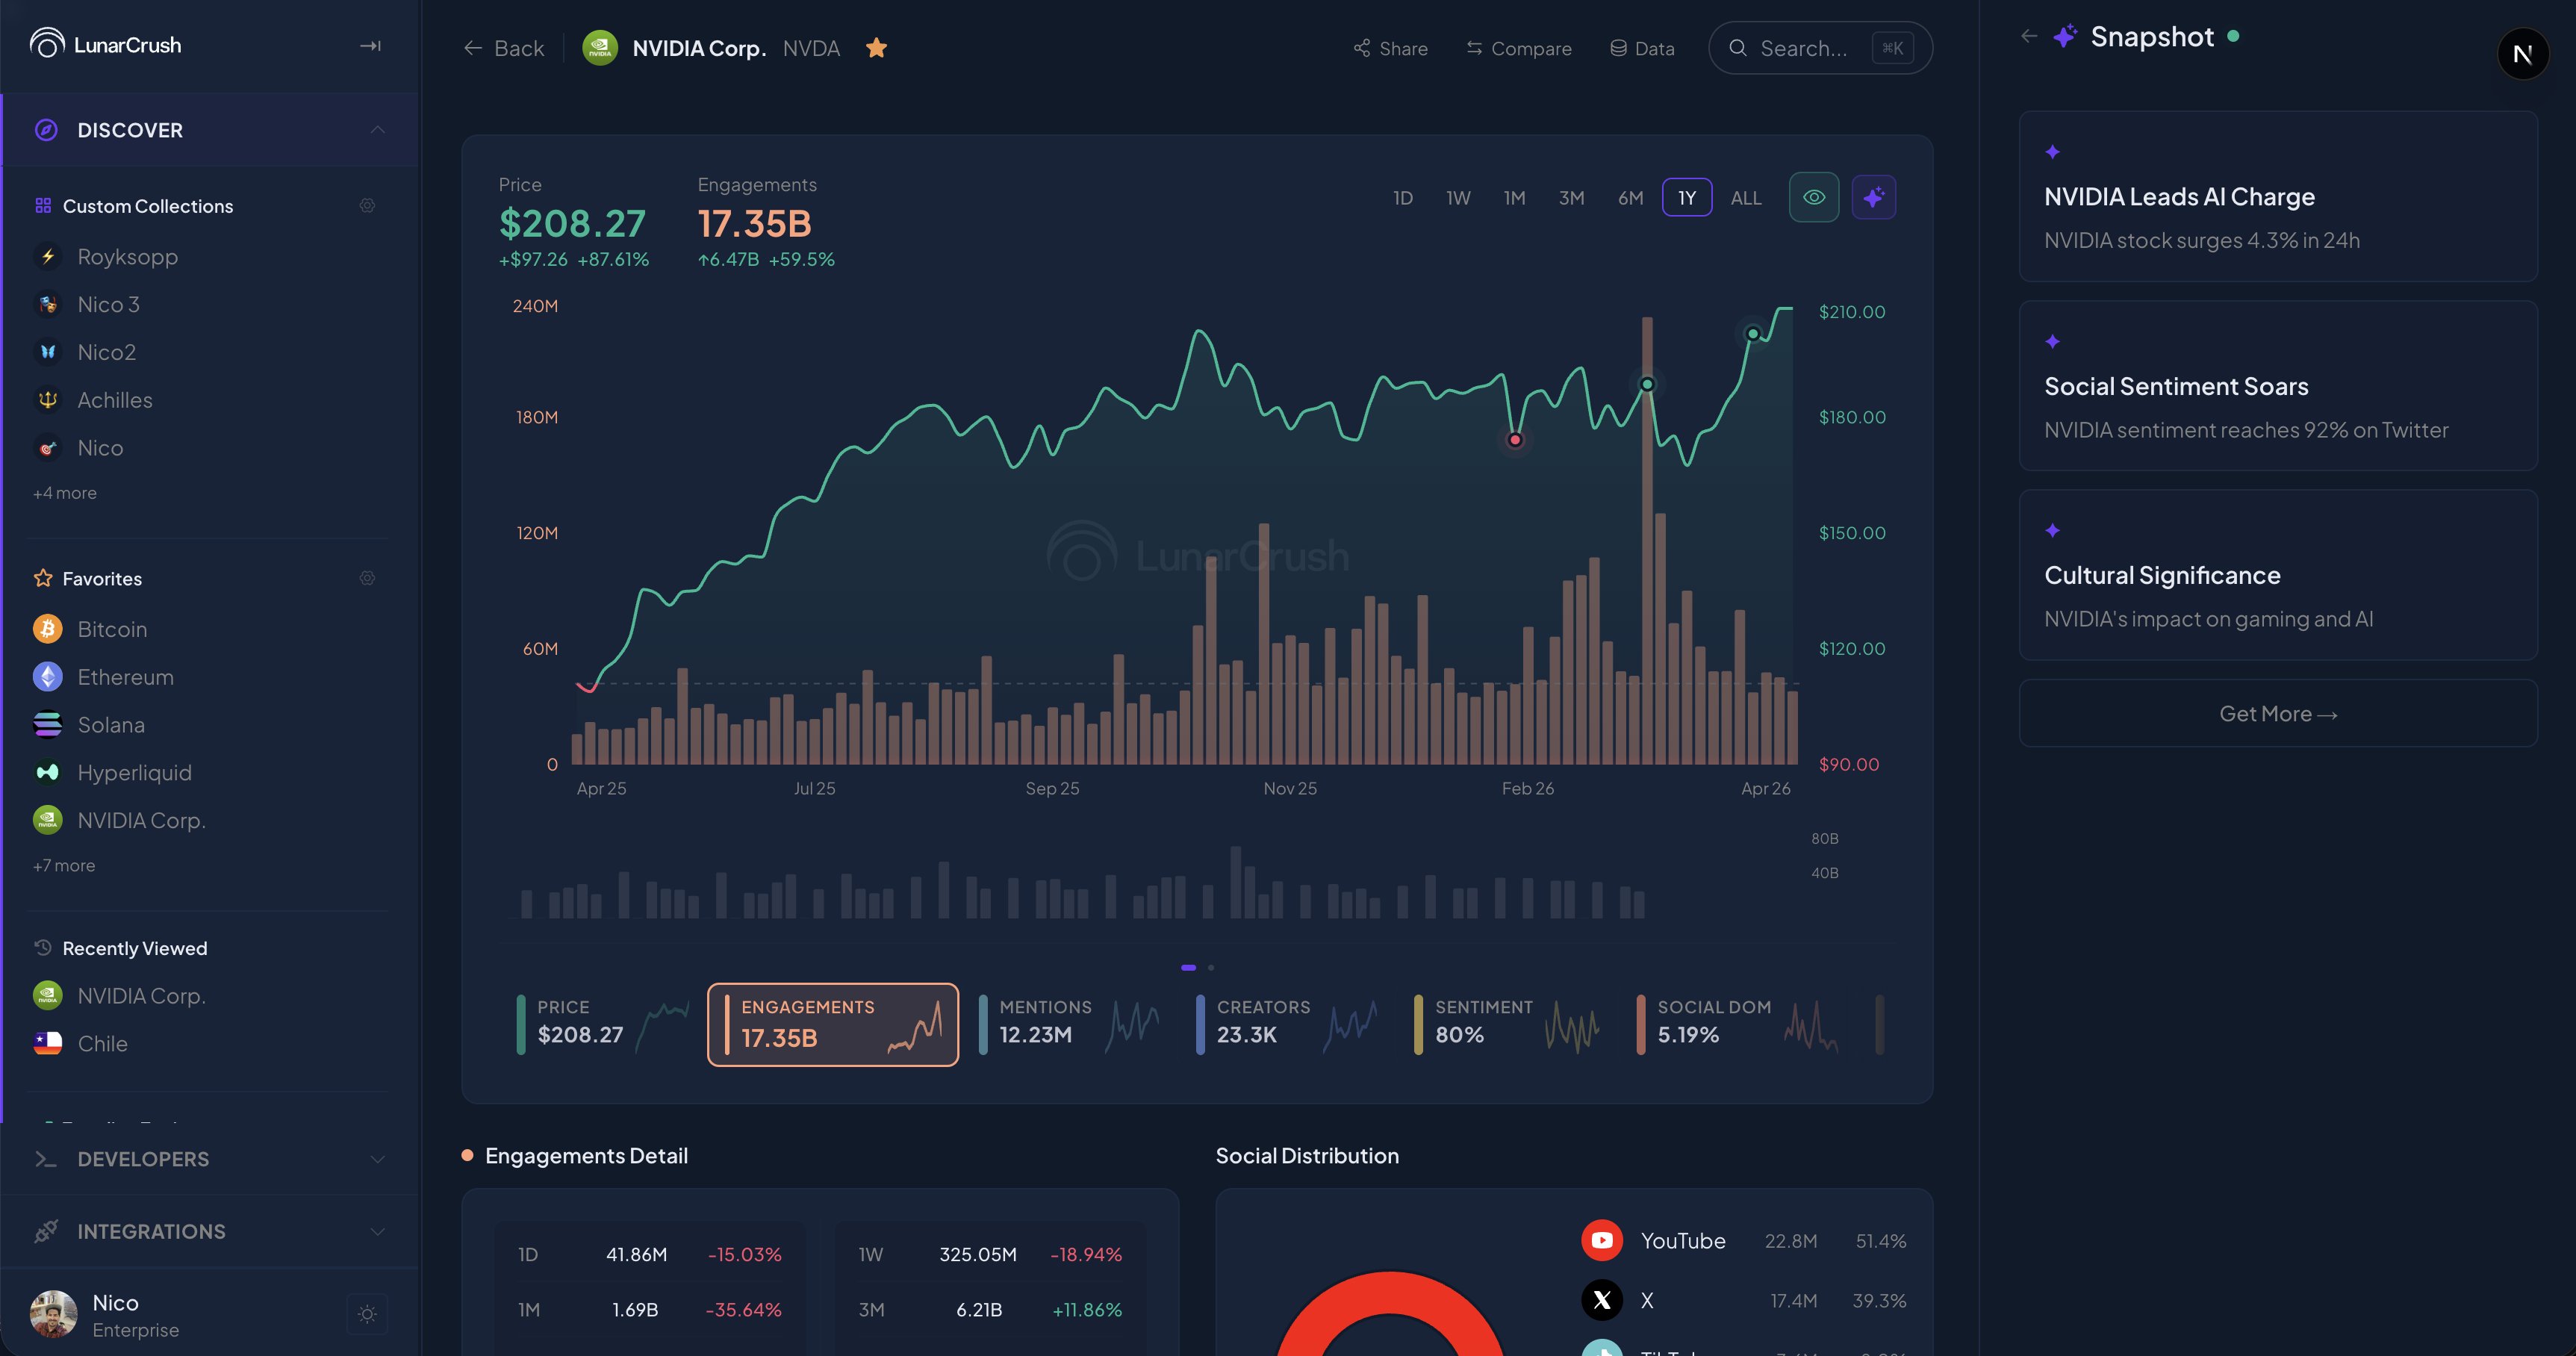
NVIDIA Corp, with its own price (208.27, up 6.82%), engagements (17.35B, up 4.4% in 24 hours), and a tile row at the bottom that shifts to include MENTIONS, CREATORS, SENTIMENT, and SOCIAL DOMINANCE. Same chart shape, same color logic, same affordances; only the underlying data and the header are stock-specific.
A handful of iterations on this surface taught me what the rebuild was really about. The chart used to have an ornamental dot on it; now hovering shows a tooltip and clicking switches the metric. The social percent change was being calculated against a window average that did not match the legacy app, so users were comparing the same number across two surfaces and getting different answers. Jon caught it on his own watchlist and we killed the window-average method. The page had a phantom price on pure topics like a country page, where there was no price to render but we were rendering one anyway. Each of these on its own is small. Together they are the rebuild.
Creator detail
People are topics. A creator page behaves like any other topic, with its own primitive shape.
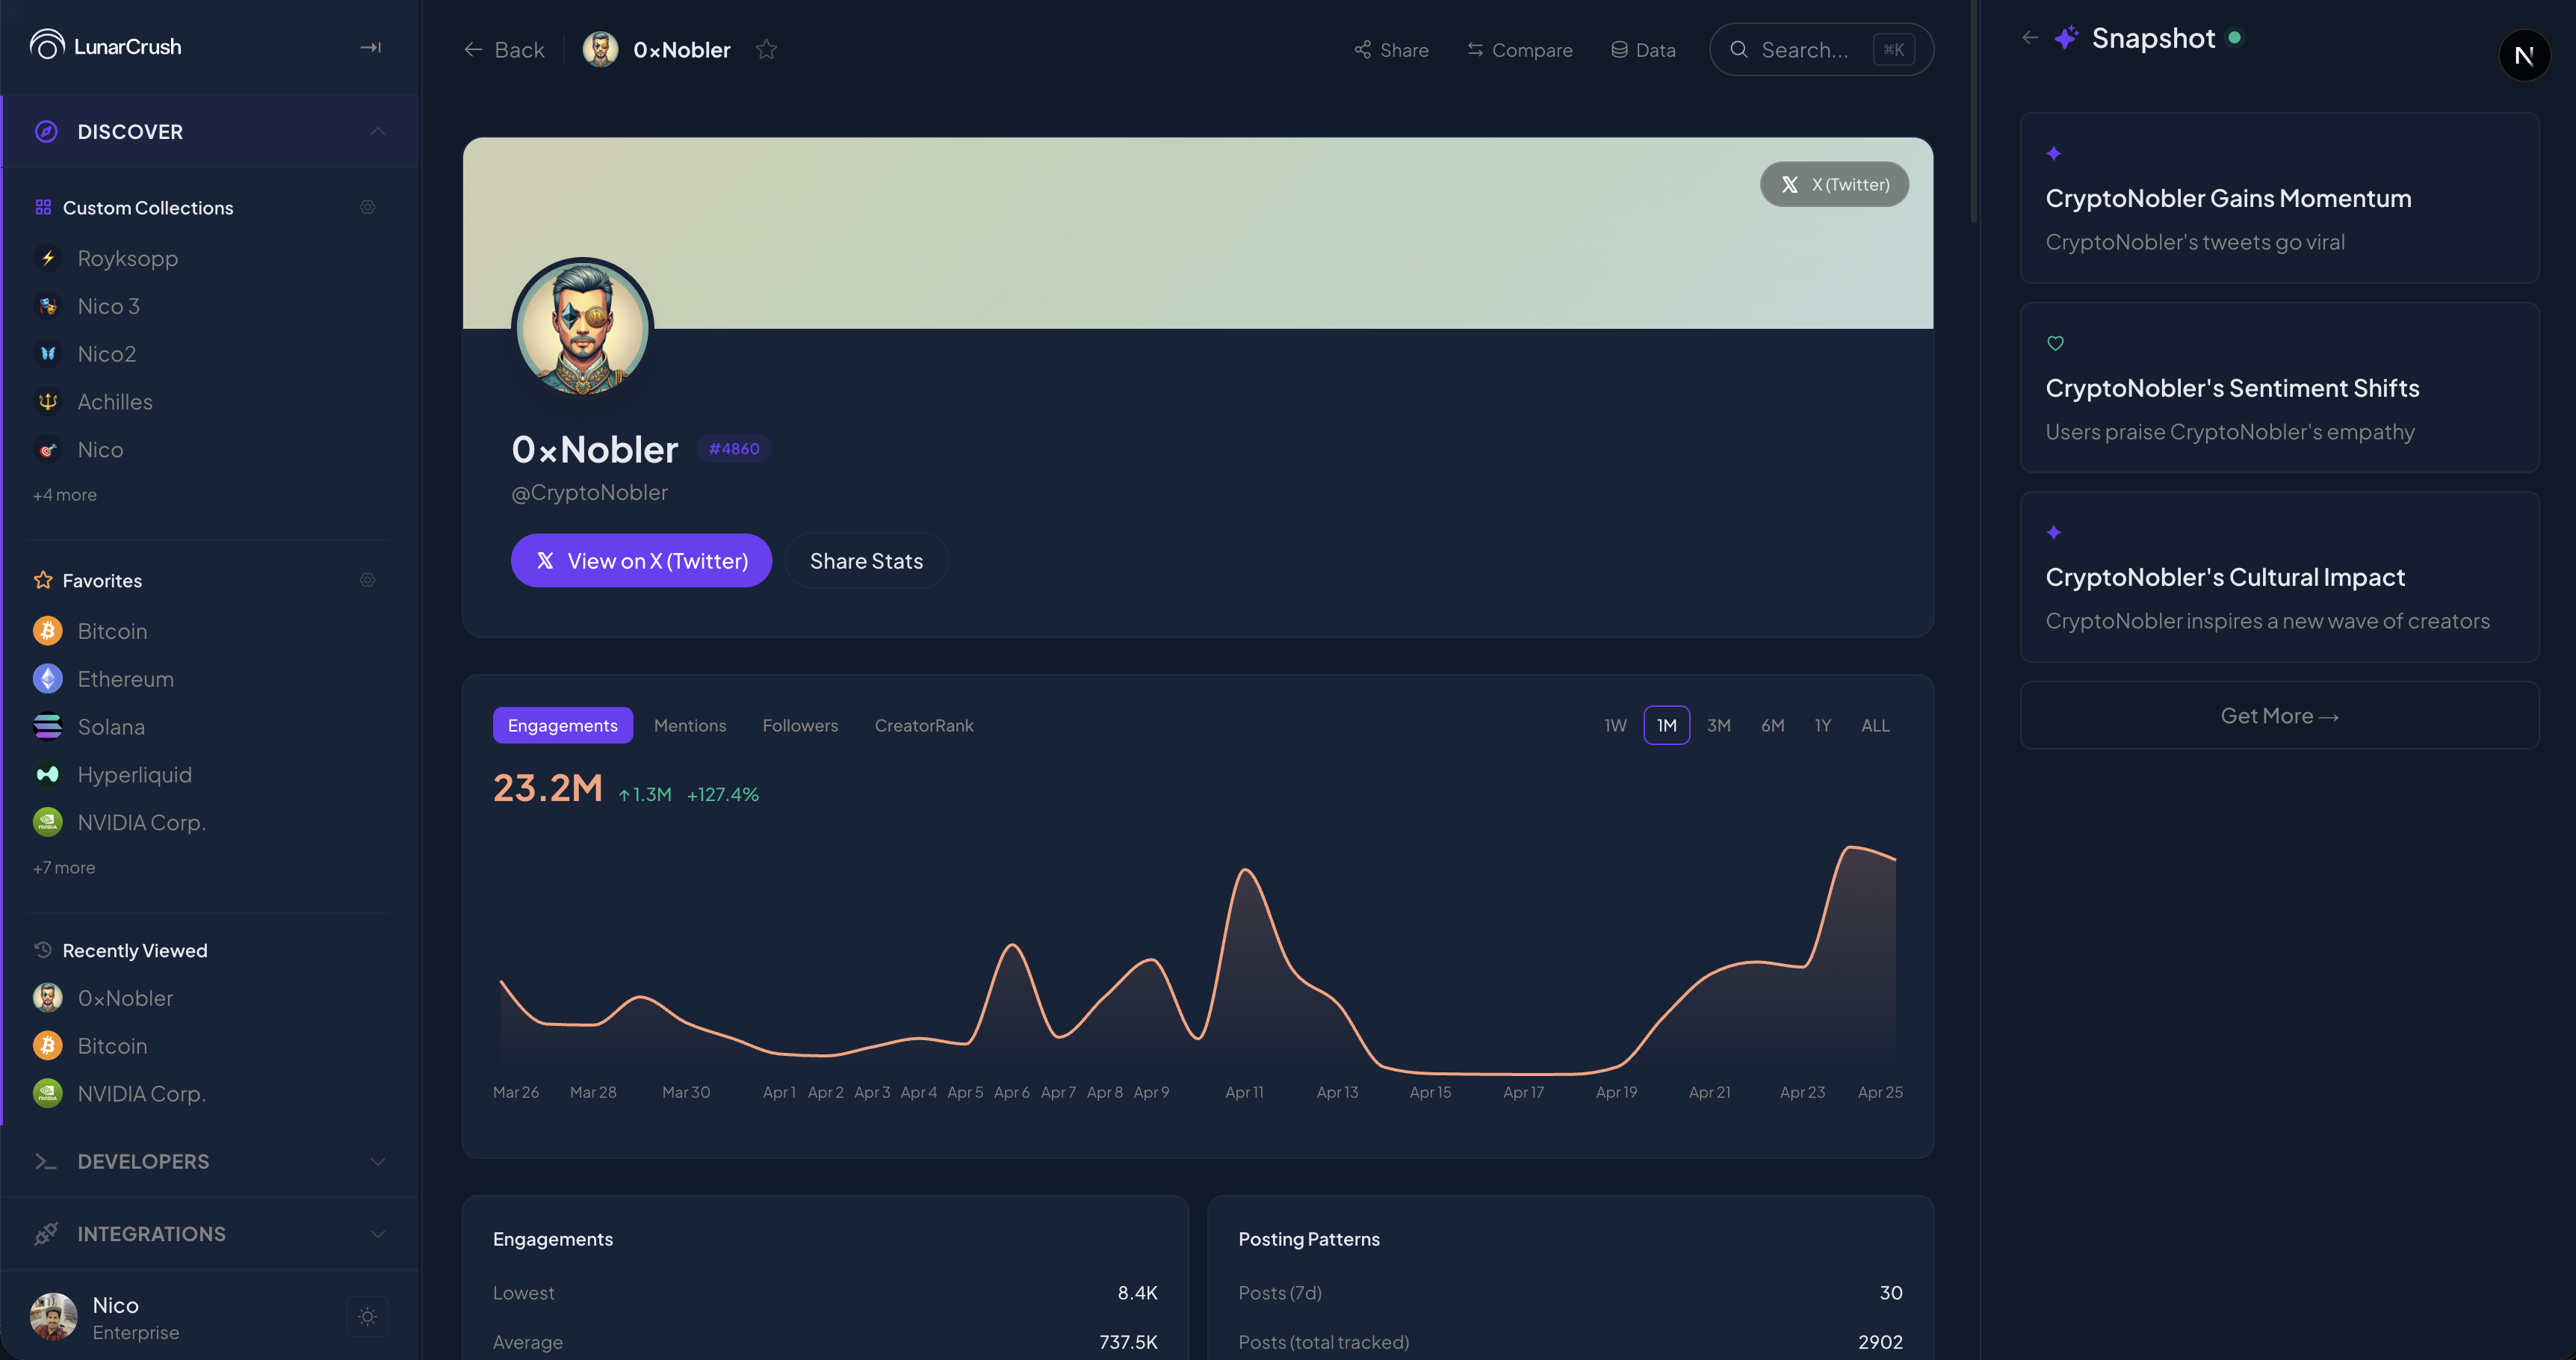
The header shifts to a creator banner with avatar, handle, follower count, and CTAs to view the creator on their platform and to share their stats. The chart underneath plots Engagements over time. Below it, metric tabs let the user pivot between Engagements, Mentions, Followers, and our internal CryptoRank. Below that, Posting Patterns and platform breakdowns. Same architecture as a coin or a stock; only the header swaps.
This was an architectural choice we made early and have not regretted. It means that when we add a new vertical (Football, a new prediction-market provider, a celebrity, a brand), the product is already designed; only the data mapping and the header variant are new.
Custom Collections
Custom Collections is one of my favorite surfaces in the whole app. A user assembles a named bundle of search terms, and LunarCrush aggregates it as if it were a native topic: its own slug, its own AI summary, its own API endpoint.
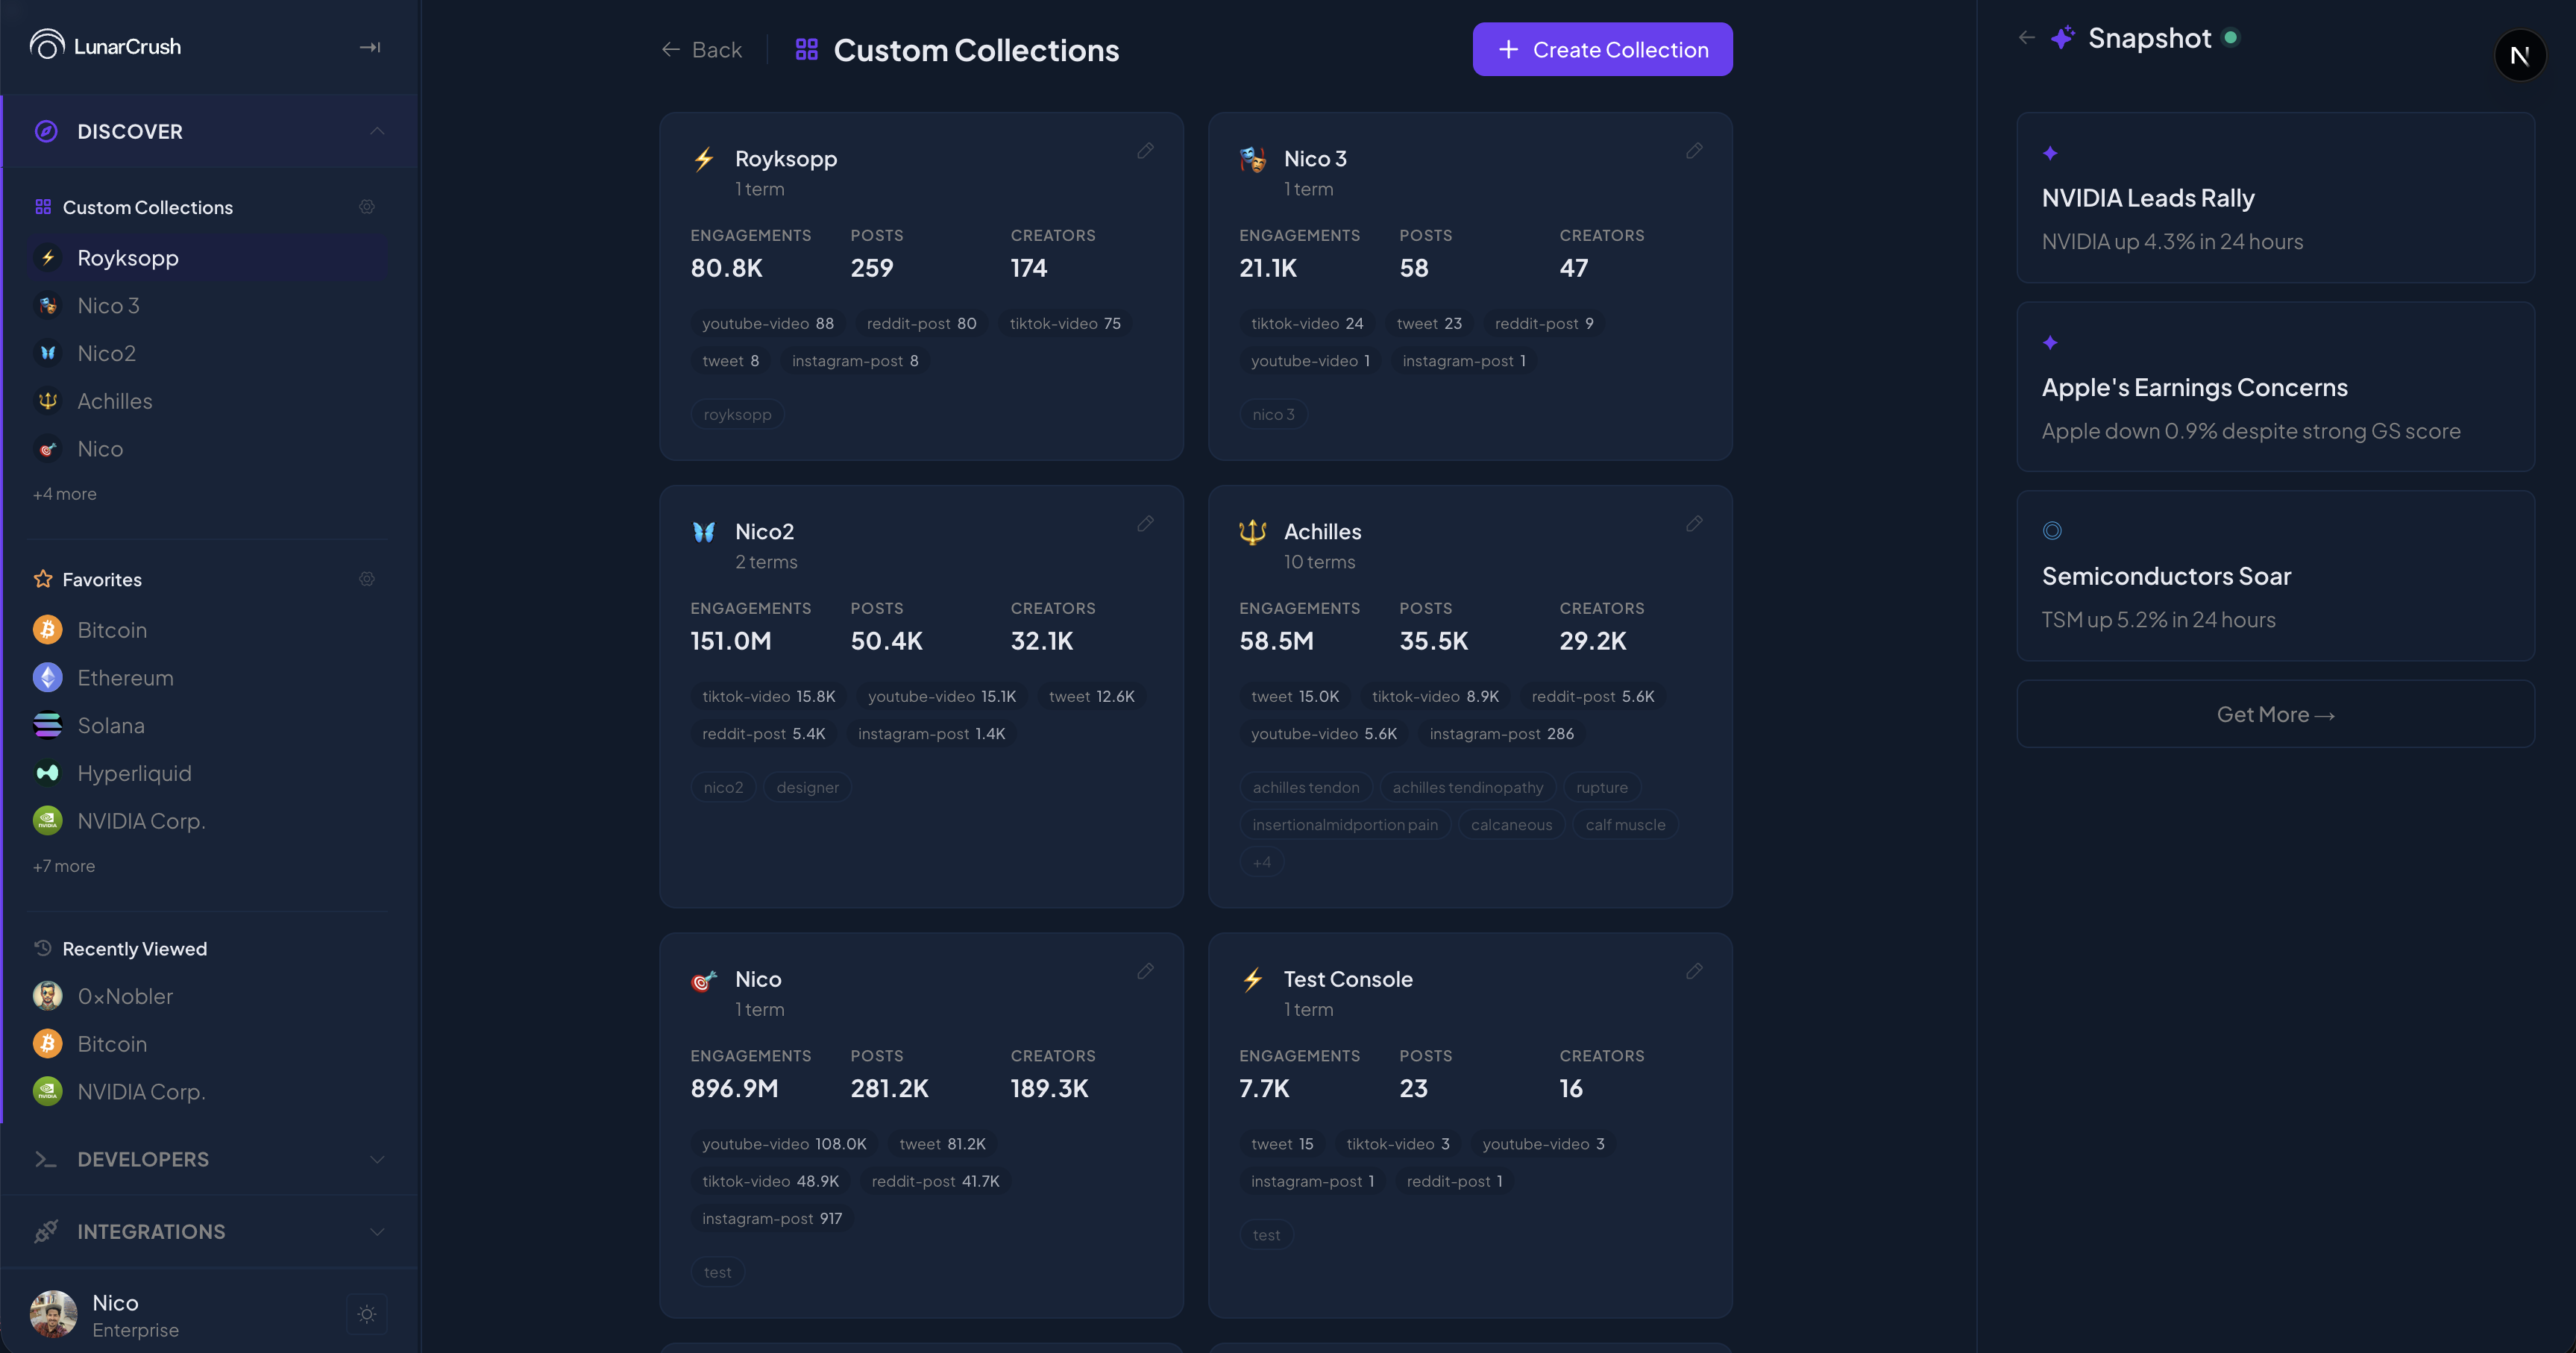
Each card on this surface is a user collection: the screenshot shows mine (Royksopp, Nico 3, Nico2, Achilles, Nico, Test Console). Each card carries Engagements, Posts, and Creators stats, and links to the collection's own detail page. A "Create Collection" button at the top opens a modal where the user picks search terms and gives the collection a name.
Drilling into a collection opens a surface that mirrors the topic primitive, with the AI affordance built in.
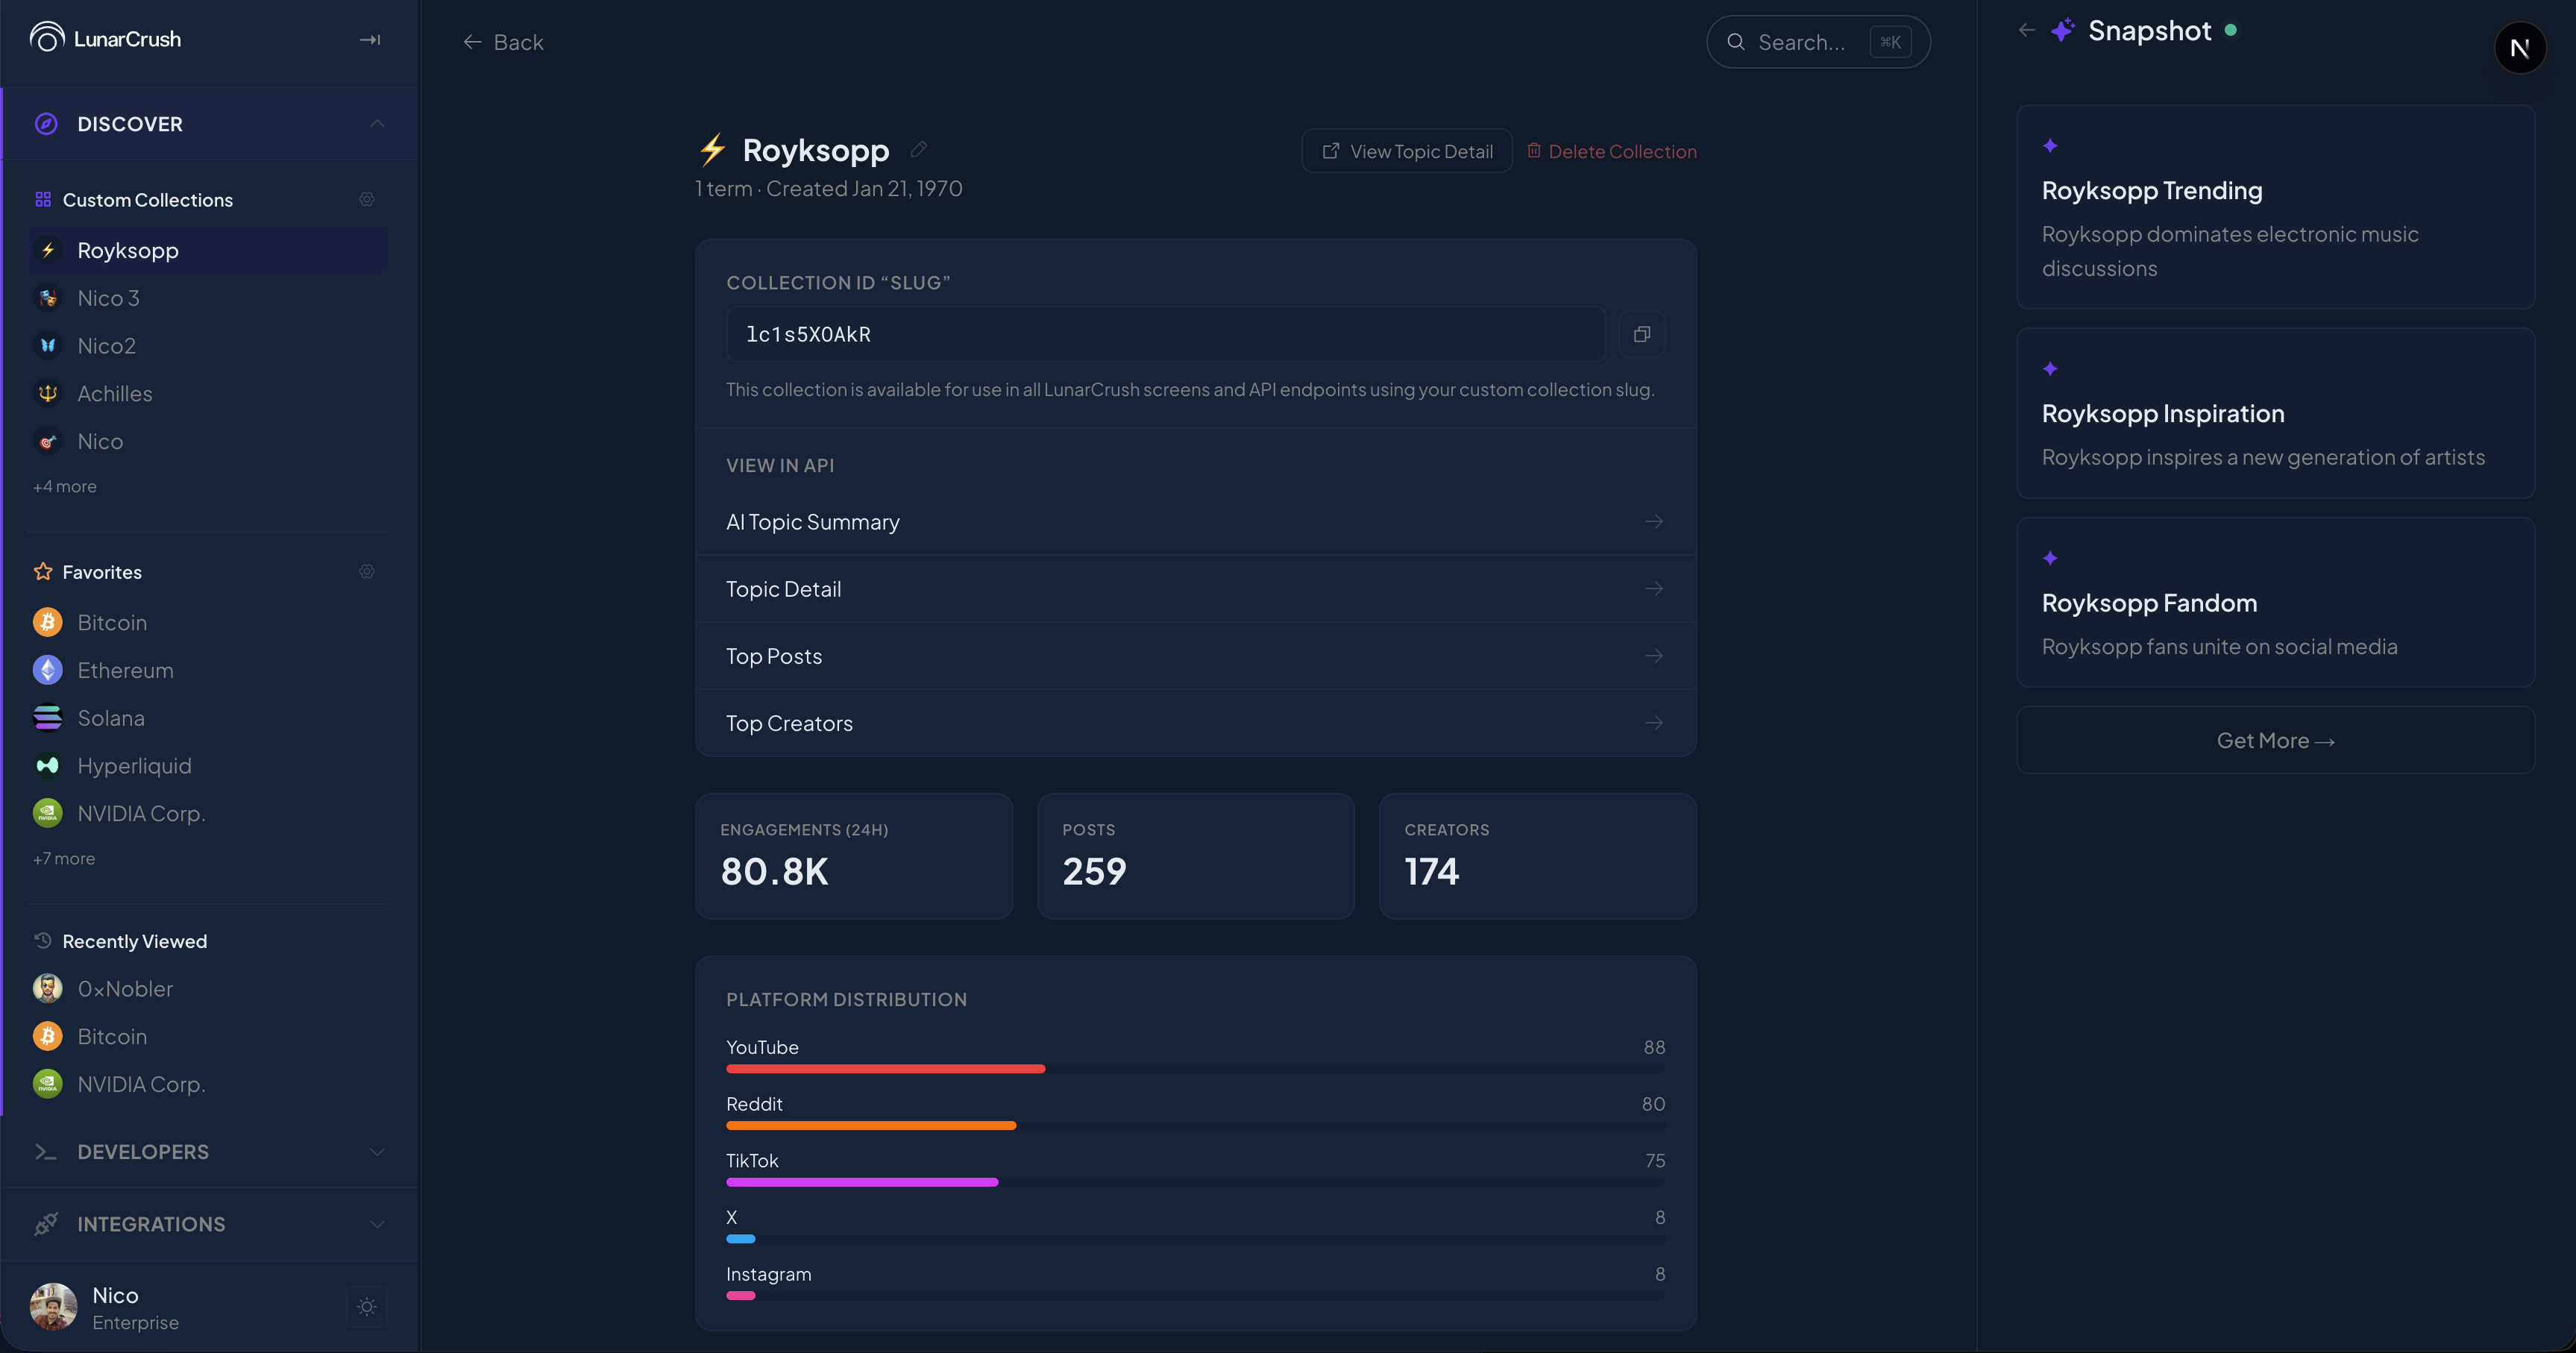
The page leads with the collection's slug: a copy-pasteable token the user can paste into their own MCP setup or API calls. Below the slug, a section titled "Use in app" lists 4 prompts ready to consume the collection: AI Topic Summary, Topic Detail, Top Posts, Top Creators. Each one clicks through to either the API endpoint or the corresponding view inside the app. Below that, the collection's Engagements, Posts, Creators, and Sentiment summary, and the Platform Distribution chart.
This is the surface where Jon's strategic argument and my design argument converged cleanly. His argument was that power users build their own benchmarks and we should make that as easy as possible because it raises retention and depth. Mine was that collections should not be a separate concept; they should be just topics, with the same primitive shape, so the rest of the app understands them natively. Both arguments converged on the design above.
Account
Account is the surface where users see what they have and what they can change.
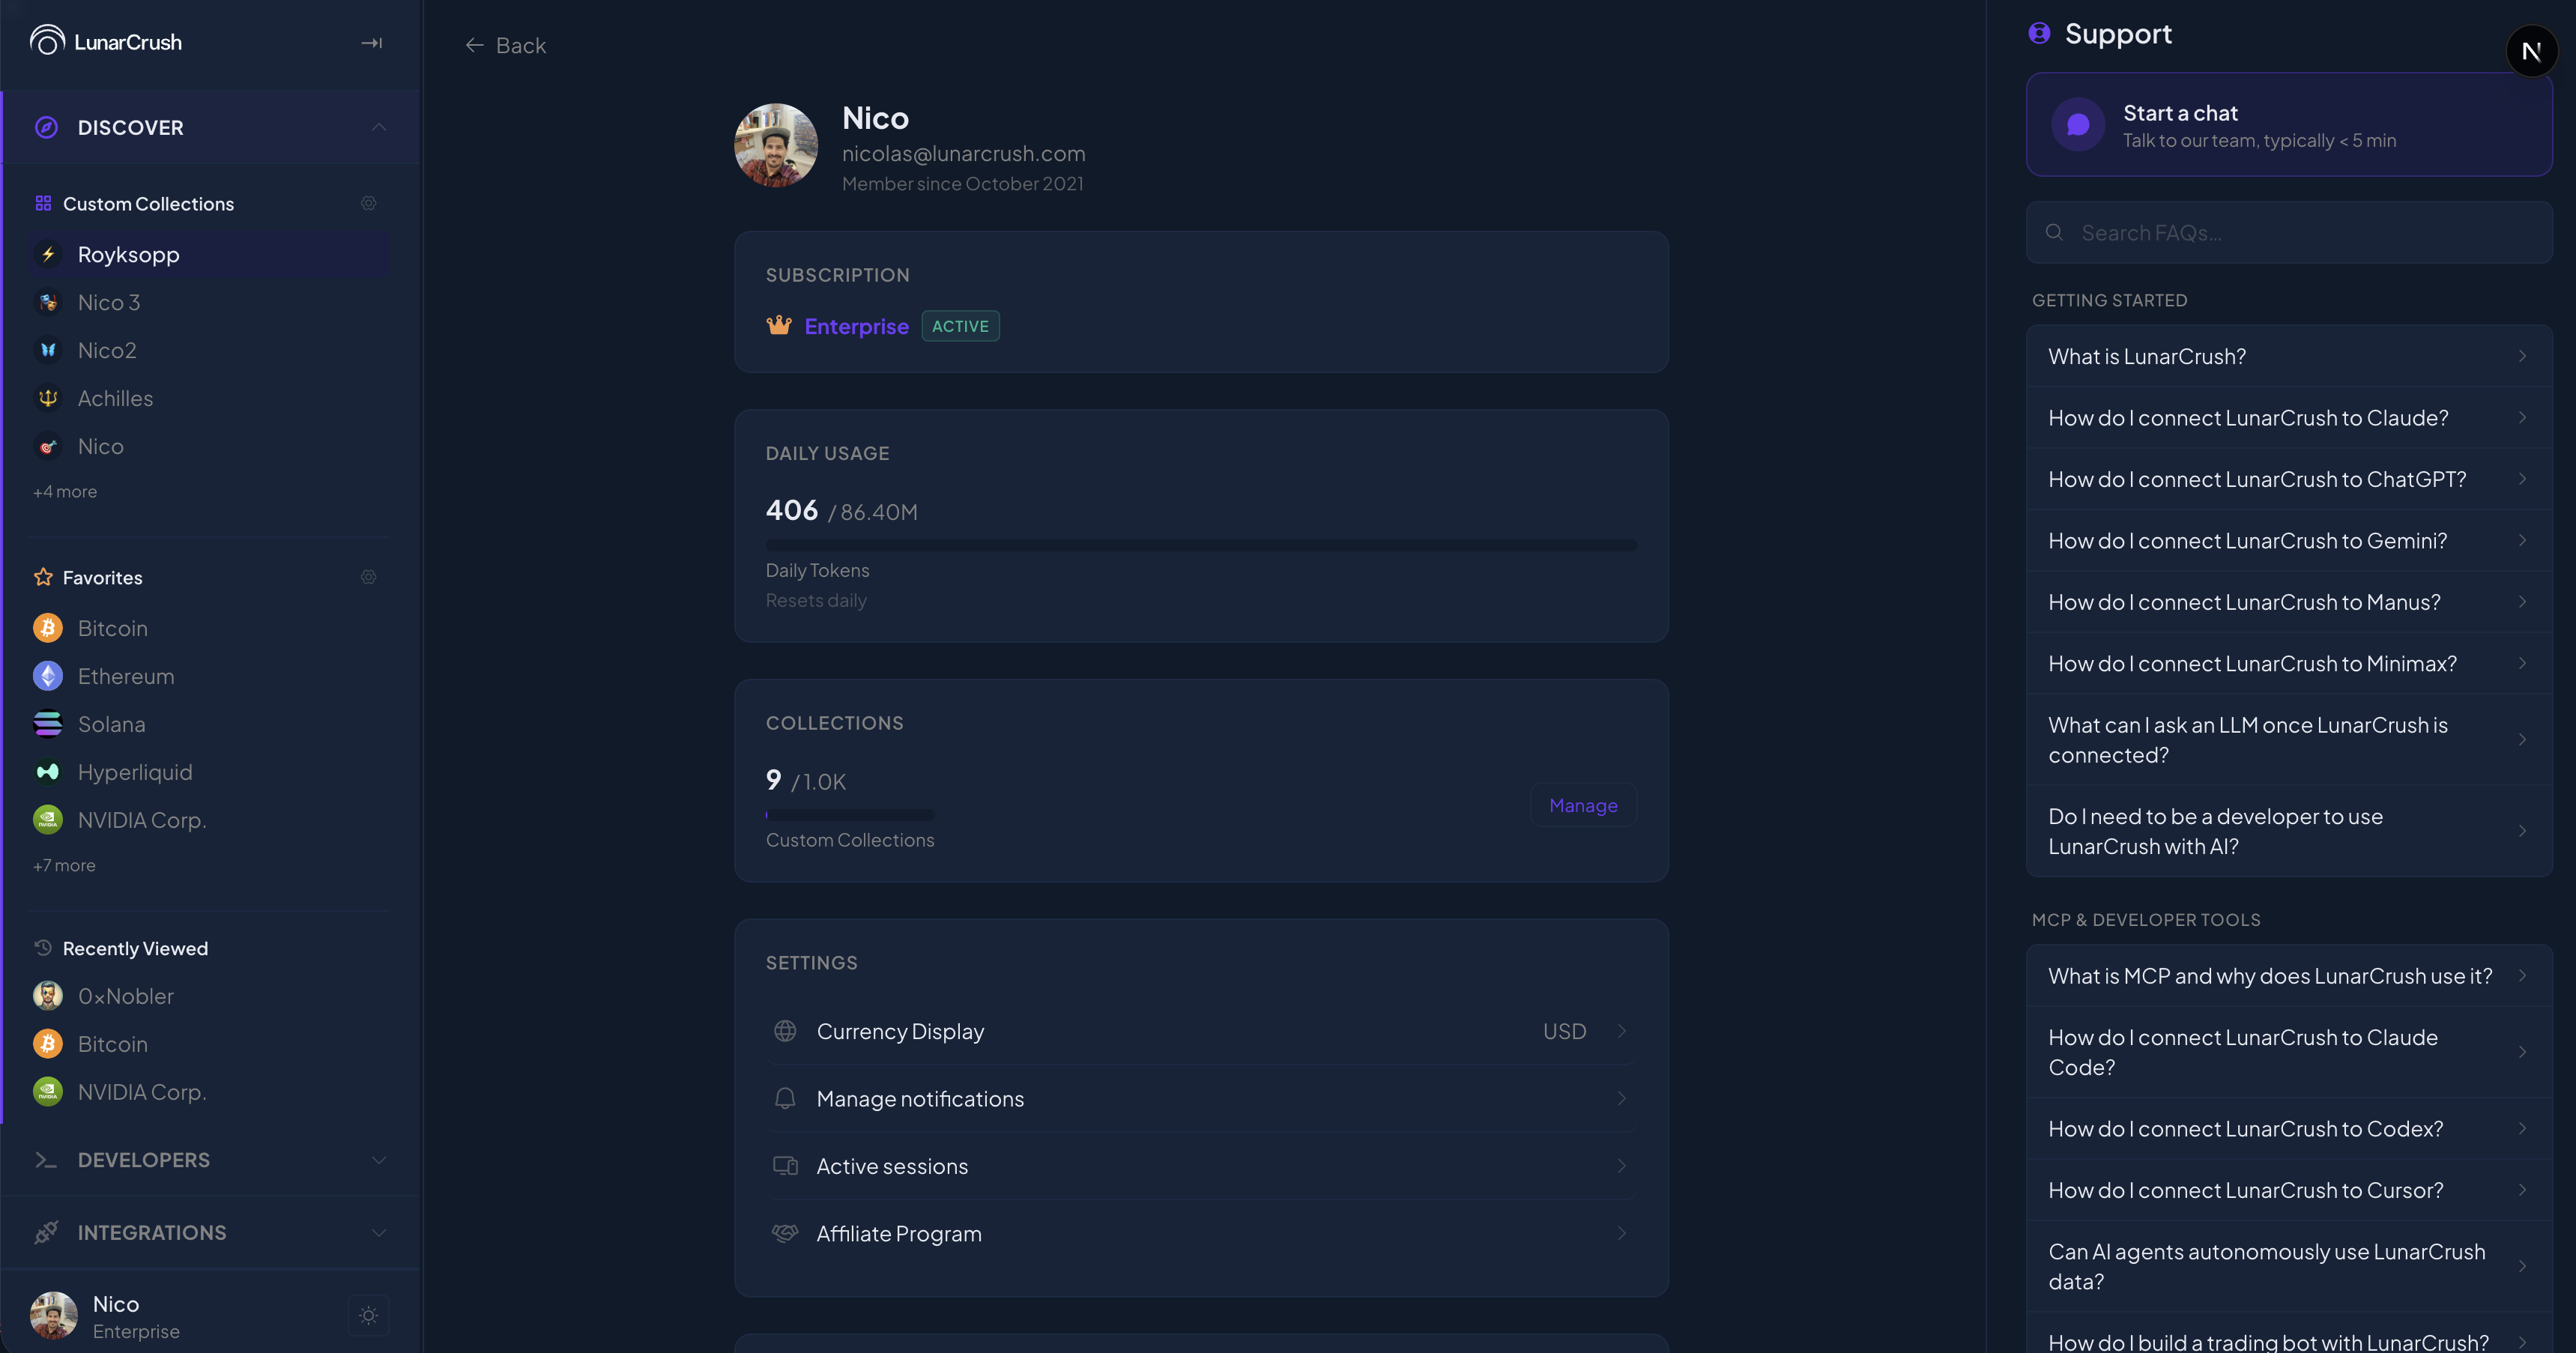
The center carries the user's subscription type and status, daily usage against the plan's quota, the count of collections they have used, and a settings list: currency display, notification management, active sessions, the affiliate program. The right panel shifts from Snapshot to a Support panel: pre-canned questions about the product ("What is LunarCrush? How do I connect LunarCrush to Claude, ChatGPT, Gemini?") and a chat affordance.
The Account surface had three iterations that took multiple sessions. The previous Account page was a single status row; the new one breaks down each subscription, shows seat counts, and lets the user manage and upgrade inline. The Active Sessions modal earlier showed a fake "you have 3 active sessions" message because we did not have a real sessions endpoint yet. We killed that and replaced it with an honest current-only modal until the backend caught up. The default name and avatar for a new user, before they upload a photo, is now a deterministic space-themed name and a seeded gradient avatar, because no user should ever see an empty header.
The interesting work on this surface, though, is the work that does not show up in the screenshot yet. To get full subscription management to live inside the app without redirecting out to a hosted billing portal, I wrote the spec for 10 new backend endpoints covering subscriptions, invoices, payment methods, plan changes, and reactivations. I also specced the session-list and session-revoke endpoints so we can finally show a real list of active sessions and let the user revoke them individually. Both specs are now in the engineering team's queue. As they ship, I wire the in-app UI to each of them.
Compare
Compare is large enough that I wrote its own case study. The short version: we kept the same URL pattern, unified the metric tabs and interval pills with the rest of the app, and added a contextual layer below the side-by-side comparison (Related Prediction Markets, Top Creators, Trending Topics, Top Posts). The next iteration is what Jon and I are aligning on now.
Integrations and Developers
About half of LunarCrush's revenue comes from customers who never open the web app. They consume our data through the API or through the MCP server. We design accordingly. Integrations and Developers are not afterthoughts; they are first-class surfaces inside the same shell as the rest of the app, handing the user their MCP link, their API key, and a growing list of model connectors. The detail of how that flow works is in the main case study.
The strategic adjacent work on this surface is the MCP server's own telemetry. Jon and I co-wrote the spec for what the MCP endpoint needed to expose so we could measure the funnel: per-request timestamp, authenticated user, the tool the AI called, response status, response time. Plus a daily aggregate. Plus an attribution tag passed into the customer record when an MCP user converts. Plus the auth-friction work, since a non-trivial share of MCP interactions were returning 401s and never reaching a paying-account flow. Those measurements are what made it possible to argue for designing Integrations as a first-class surface in the first place.
The data layer
The product is AI-powered in a way that requires production-grade reliability. Every Insights paragraph, every Snapshot card, every AI Topic Summary is an LLM call that has to be cheap, fast, and resilient.
The chain we run today goes through 5 providers in order: Cerebras's Llama 3.3 70B as the front of the chain, Groq's 70B as the first fallback, Groq's 8B as the cheap fallback for follow-up queries, Gemini Flash as the long-tail backstop, and a cached fallback for the cases where everything upstream has failed. Each provider is bounded by its own timeout. Gemini is capped at 10 seconds. Cerebras moved to the front of the chain after we measured its real-traffic latency and found it was fast enough.
A handful of decisions in this layer paid off. We added two response headers (one that names which provider answered and one that reports how long it took) so we can debug a slowdown at a glance. We surface Groq failure reasons through a third header, so when Groq fails we know why before the user does. We bumped the cache TTL from 5 minutes to 30, because most of the AI prompts on Discover are answering "what's happening with X right now," the same question across thousands of users. Caching for 30 minutes is the difference between paying for one inference and paying for 10,000.
We also log every LLM call and every data-proxy call to Cloudflare's Analytics Engine, which closes the loop: we can ask which provider is answering most cheaply, which surfaces are costing us the most, which prompts are too long, and how the AI usage curve is moving over time.
The strategic groundwork
Some of the most consequential work in this rebuild is not visible in any screenshot. It is strategic specification, channel analysis, and vendor evaluation.
The customer audit I described at the top of this case study was a piece of work in its own right. We pulled the relevant records out of Stripe, ChartMogul, and the user metadata, joined them to API and MCP usage, and let the funnel speak for itself: roughly 28,600 landing visitors converging into a few dozen weekly returning users, 15.7% monthly churn, and a feature-engagement table that put Collections at 97% and Categories at 51%. Out of the audit came the next round of metadata work: last-login timestamp, plan-fit flag, real client IP at signup, signup landing page, page categories visited. That data is the layer the rebuild's retention measurement will sit on top of.
The MCP funnel quantification is the second piece of strategic groundwork. The numbers are not estimates: more than 399 signups through the Claude MCP integration, growing into 43% of all signups and doubling weekly, with a conversion rate to paid that sits at roughly zero. They came out of direct measurement we set up specifically for this analysis. They are the data that justified the architectural decision to make Integrations a first-class surface in the rebuild rather than a settings page.
The vendor stack call was the third. We currently load Intercom on every page of the app for support and email campaigns. The plan, now in the queue, is to retire Intercom and migrate to our own Resend infrastructure: single emails, batch emails, campaigns, all running through a Cloudflare function. The campaign list lives on our side. The support chat is replaced with either a free alternative or a custom contact form that lands in our own inbox. The migration touches the layout, the email templates, the campaign logic, and the user-list connection. It is a fair amount of work, and it removes a recurring cost while letting us own the feedback loop.
This kind of strategic groundwork (audits, specs, vendor migrations) is what a Head of Design role looks like in practice at a small, high-stakes team. The line between design and operations is thin when the company is rebuilding its product, its acquisition funnel, its customer infrastructure, and its email stack at the same time.
What comes next
The rebuild ships to production in May. That is the start of the next phase, not the end of this one.
From day one of production rollout we are watching churn against the 15.7% baseline, the funnel return rate against the 5% baseline, prompt usage per session, conversation depth, integration activations, the API-only segment's engagement with the web app, and the per-card click-through on Top Movers, Spotlight, and Snapshot. Each metric has an explicit threshold and a measurement window. The cadence is weekly reviews with Jon and Joe to read the dashboards, bi-weekly retros with the broader team to decide what to ship next, and monthly design reviews to keep architectural drift in check.
Once Intercom is out, the feedback signal lives on four channels we own. An in-app contact form replaces the chat. A daily and weekly digest goes out through Resend with engagement tracking. Short prompted surveys land at key moments: after onboarding, after the first prompt submission, after the first MCP connection. A quarterly NPS pulse goes only to active accounts, never to ghosts.
The relaunch carries an updated marketing page, a refresh of the use-cases and enterprise pages, and a coordinated announcement across X, LinkedIn, Telegram, the email list, and the developer Discord. The brand surface I have been building is what keeps those comms consistent across channels: the same logos, colors, and voice land everywhere. The blog, currently underdistributed, gets a distribution plan it deserves: cross-promotion from the marketing site, internal links from inside the app, and a dedicated SEO pass. The MCP funnel data is the evidence base for deepening the partnership with Anthropic and any model partner we work with going forward.
The largest piece of new product work in the months ahead is the creator workstream. Three connected surfaces. A dedicated Creator Index page across all categories and platforms. A creator verification flow built around tweet verification: the creator posts a phrase from their account, our pipeline detects it, and the profile gets a verified badge. The largest of the three is an AI-driven posting assistance tool that helps creators write their own posts using our social-intelligence data; it analyzes trending topics, drafts posts in the creator's style, suggests timing based on their engagement patterns, A/B tests angles, and tracks performance. Built on the LLM infrastructure already running in the data layer. It would reposition the product from "an analytics tool creators check" to "a creator tool creators work inside."
Scaling work runs alongside. A full mobile pass on the surfaces that were desktop-first. A real notification system across push, browser, and email, for price alerts, narrative spikes, and Custom Collection events. New verticals as the architecture allows them: Football leagues, more prediction-market providers, additional country verticals, brand verticals where consumer brands become topics in their own right. Internationalization, with Spanish as the second language because the social-data pipeline already covers a substantial Latin American audience. Performance hardening: Lighthouse passes, bundle budgets, edge caching for the heaviest endpoints. A pricing and packaging revisit, informed by the audit's plan-fit findings. An automated subscription health check that catches the incomplete-expired pattern. The affiliate program, already linked from Account Settings, finally built out.
The design system, the brand, the front-end governance, and the AI-assisted workflows should be a practice at LunarCrush by the end of the year, not a single contributor's portfolio. Concretely: a documented, machine-readable design system any new designer or engineer can consume and contribute to; a CI gate stack that catches drift automatically; a library of skills built on top of the system that lower the cost of contributing without lowering the quality bar; a parametric brand definition that powers the brand page, our image-gen pipelines, and the screenshot beautifier; a weekly review cadence that survives any single absence. The rebuild is the deliverable. The practice is the moat.
Closing
Working on this rebuild has been the most ambitious assignment of my career. The hours in the sessions with Jon, the late commits, the iteration loops in the screenshots above, the audits and specs and vendor calls behind them: that is what the work has been made out of.
Role: Head of Design, LunarCrush. January 2021 to present.
Team: Joe Vezzani (CEO, my manager), Jon Farjo (CPO), Dan Williams (CTO).
Related work: The Product · Design Rationale · Compare · Landing Pages · Trading Bot.
Latest updates
- Free users, paid users, and the seam between them: A checkout that kept saying Free after a real payment, a snapshot chip that told the wrong time, and an upgrade reminder system designed from how free users actually behave.
- A dashboard built around useful work: Turning two product conversations into a presentation, a revised onboarding audit, and an ordered plan for dashboard and recipes.
- Teaching search to wait before it says no: A LunarCrush search fix that turned one bad empty state into three explicit states: still looking, possible correction, and real no-match.
- Making LunarCrush feel faster: From Dan's feedback to production verification: tables, first loads, navigation, product decisions and the work still ahead.