Making LunarCrush feel faster
LunarCrush · Product design + front-end · September 8-21, 2026 · Measured in staging and production; continued through September 23
From Dan's feedback to production verification: tables, first loads, navigation, product decisions and the work still ahead.
Optimizing LunarCrush has been product work as well as front-end work: understanding why a table feels heavy, why a click changes the URL but leaves the previous view on screen, or why a page that feels fast to one person takes ten seconds for another. The concentrated work on Friday, September 18, and Saturday, September 19, grew out of earlier feedback and continued with a navigation fix on Sunday, September 20.
My contribution was connecting that feedback to reproducible user journeys, prioritizing corrections, reviewing implementations and checking what actually changed in use. This chronicle follows that process from September 8 through September 21, including unsuccessful experiments and remaining work.
Dan's feedback: less background work, a more responsive interface
On September 8, Dan called attention to the volume of requests generated by the app. The subsequent investigation found 748 per-coin update requests in ten minutes with a category open in a paid session, around 74.8 per minute. Hiding the tab stopped that request family. It also found full catalogs being downloaded to track favorites, and data for 48 posts being prepared for a carousel displaying 20.
That led to a specific product decision. On September 9, I rejected the proposal to remove or slow per-row updates: I wanted to preserve the visible motion of live values. Savings also had to come from elsewhere, such as fetching only what favorites need and preparing only the displayed posts. An investigation and its proposals are not shipped changes; this first step separated waste from intentional behavior.
On September 17, Dan identified the category table as a major contributor to sluggishness and flagged repeated downloads of coin and stock indexes. Joe reported roughly ten seconds entering crypto from a private tab, while Dan saw less than two seconds. That difference pushed the investigation beyond a fast, already-loaded session.
Two people could be describing different experiences
Reproduction on production used a cold browser profile and 4× CPU throttling. The full journey (opening Home, being able to click Crypto, and seeing rows) took 2.6 seconds with an uncapped connection, 3.7 seconds on fast 4G and 10.8 seconds on slow 4G. In the slow case the browser spent less time computing: it was waiting for the code needed to accept the interaction.
That changed how I evaluated the work. I separated first visits from in-app navigation; guests, Free and paid accounts; visible detail from a chart with data. These are different moments in the experience. Reducing bytes can help the first without fixing a stall that appears after several minutes of browsing.
The same discipline ruled out a tempting conclusion: removing 1.6 MB of catalog traffic did not move LCP or main-thread blocking in the recorded A/B. It reduced resource consumption, but that test did not demonstrate a speed improvement.
The table kept working when nobody touched it
The table feedback led to measurements after loading had finished. On crypto, the main thread remained busy even without network activity. Geometry measurements and renders repeated while producing identical DOM. The sticky column changed width and fed the cycle that measured it again; fresh per-row functions also prevented render reuse.
The correction avoided updating the model when its values had not changed, stabilized opening callbacks and narrowed DOM observation. Across three alternating staging runs, with 4× CPU throttling and an eight-second idle window, median blocking fell from 3,928 to 1,131 ms. The table retained its 100 rows and sticky column; a separate 785-row table still had no measured blocking.
The result was substantial but partial: the target of less than 500 ms was not met. Category-click latency did not change meaningfully either. The delivery was promoted to production on September 18, with remaining work separated into an investigation of state updates affecting mounted tabs. A table consuming less CPU and navigation responding sooner needed different corrections.
Friday: inspect what every page loads
I started with first-load dependencies. The not-found pages were declared as client components and produced chunk groups that duplicated parts of the workspace. Making those entries server components let them share the client references already used by normal pages.
The first local build reduced the Home and crypto entry from 53 to 41 scripts. After four cuts on Friday, staging measurements of the code downloaded by the parser before boot on crypto went from 53 to 38 files and from 743 to 519 KB gzip, roughly 30% less. This measures compressed initial code, not all session traffic.
An intermediate comparison also measured the visible effect: on a Scale account, with emulated 4G at 4 Mbps, 150 ms latency and 1× CPU, median time to the first 20 rows fell from 4,994 to 4,022 ms across three alternating pairs. On a normal connection, differences stayed within run-to-run variation. These conditions differ from the 10.8-second cold-start test; those figures cannot be combined into a before/after comparison.
Error screens also loaded dependencies that were only needed after a failure. I kept a minimal response immediately available and loaded the full error panel on demand. For icons, I reviewed the weights the interface actually renders so unused variants did not have to ship.
Alongside that work, I moved detail-chunk downloads earlier and addressed data identity. When a page recognized that a topic was a coin, it could request information it had already fetched. Keeping that identity stable removed approximately 630 KB of repeated fetching documented in the audit. Early loading of series, detail and profile data was extended to authenticated sessions, while ensuring the chart consumed the correct data family.
An optimization that needed correction
I also tried removing permanent compositor layers from animated numbers. An A/B comparison on the same build, with 4× CPU throttling, showed Chrome repainting the digits: 3,471 paint events versus 644 with the compositing rule retained.
I restored will-change on those tracks. The other changes stayed, including caching the number formatter and removing unnecessary table-mount work. Reducing layers had a cost that became visible in the trace; that measurement determined what to keep.
Saturday: follow the click through to the data
The audit showed that topic categories made far more requests than crypto and stocks. When opening a detail, the application also attempted to resolve identity through sequential coin and stock lookups. Some journeys involved eight or nine network round trips before the main requests could start.
The selected row already knew its topic. I carried that identity with the click and grouped the remaining remote resolution into two waves. In the recorded staging comparison, navigating from agencies to WPP went from 3.79 to 1.53 seconds until the chart had data. NFL to Arizona Cardinals went from 2.73 to 1.58-1.91 seconds.
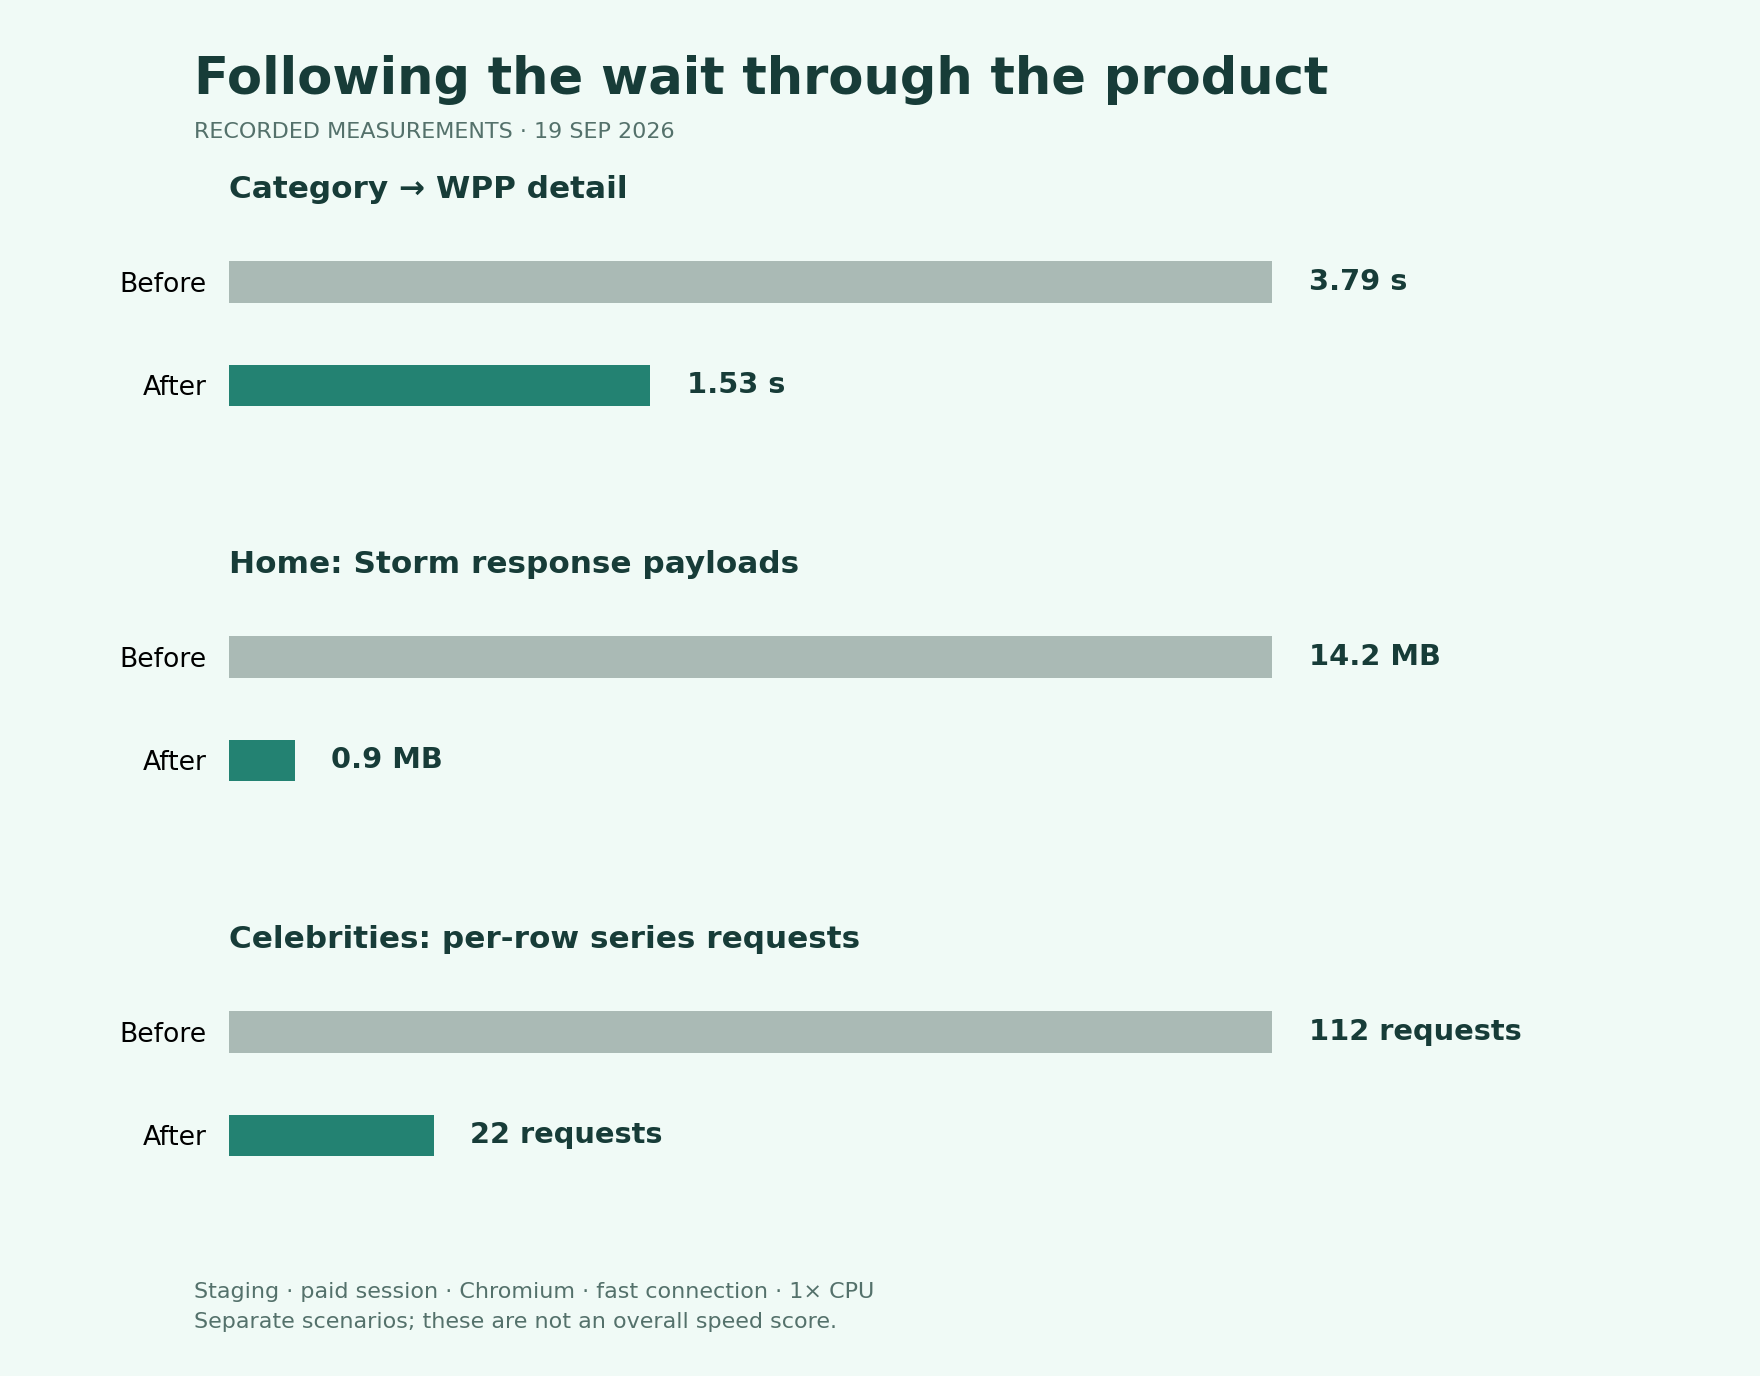
Visualization reconstructed from the September 19 audit. These are separate staging scenarios with a paid session, headless Chromium, a fast connection and 1× CPU. Runs vary; these are not real-user metrics or an overall speed score.
Request less and use what is already available
I limited per-row series fetching to rows that had entered the viewport. In the specific Celebrities comparison, those requests fell from 112 to 22, and total GET requests from 445 to 349. This does not mean every remaining request was unnecessary or that every category achieved the same reduction.
Avatars exposed another problem: a cancelled load was recorded as though the image had failed. I corrected that handling, removed a fallback route that no longer returned X images, and adjusted the capture budget. The USDC creator strip went from 17 to 39 visible images out of 48 profiles. Some cases remained unresolved.
In NFL, three original headshots totaled 591 KB despite appearing in small spaces. The resizing path that ultimately worked reduced that set to 2.6 KB. The first Cloudflare image-transformation attempt was unavailable on that zone; the measured result belongs to its replacement.
For Insights previews on Home, I separated the public summary from the richer information needed when opening a snapshot. Recorded Storm response traffic fell from 14.2 to 0.9 MB in that scenario. The opened view still completed its referenced posts using the user's session. I also stopped requesting full creator rosters when only avatars were needed, and added compact previews for those consumers.
Search and charts needed another pass
Shortening the search entrance animation did not move the roughly 320-325 ms wait before the input appeared. Subsequent traces pointed to component suspension and two import sites producing different copies of the code. I consolidated modal loading and retained the search index between openings. The commits document that correction; I do not have a comparable final measurement here to turn it into another improvement figure.
I also reverted a Home-chart warm-up: it added 293 KB without improving chart appearance in the tests. On Saturday evening, a further change introduced one shared asynchronous Recharts runtime across chart surfaces, with a test detecting direct imports that could recreate the copies. That later implementation must be distinguished from the morning audit's measured results.
Sunday: the URL changed, but the screen stayed behind
On September 20, I was still seeing a problem opening Money from Finance: the address changed immediately, but the previous table remained visible for seconds. It also happened in Events and Currencies. Initial tests in fresh sessions did not reproduce it. The decisive condition was navigating again after the full catalog had loaded.
The detail header resolved the same topic identity inside every iteration of a coin lookup. For unmatched topics, that meant scanning the catalog repeatedly. These warm navigations downloaded no new JavaScript chunks; computation was the bottleneck. I also verified that staging and production both included the Recharts change, while production still lacked the indexed resolver already present in staging.
The shared fix resolved identity once before the scan and promoted the existing index, preserving classification rules. After deployment, 32 staging and 34 production navigations were verified, including revisits, mobile and an authenticated account, with no JavaScript errors in those tests.
| Production, 4× CPU throttling | Click to visible detail | | --- | --- | | Money: before, full catalog loaded | 2.6-4.3 s | | Money: after, five revisits | 359-426 ms | | Events: after, five revisits | 262-295 ms | | Currencies: after, five revisits | 389-448 ms | | AI: after, five revisits | 363-442 ms | | Money: mobile revisit | 372 ms | | Money: authenticated revisit | 422 ms |
Browser measurements from September 20. Ranges describe these runs, not real-traffic percentiles. Rows without a baseline are not before/after comparisons.
The user-facing improvement was direct: opening a topic no longer left the previous screen in place for several seconds. This measures visible detail, not completion of every panel. Across Money's five revisits, the chart with data arrived later, between 1.11 and 1.29 seconds. Keeping those times separate avoids presenting a quick header as a fully loaded page.
What changed in use, and what remains
The work addressed different moments in everyday use: less waiting for initial rows on a limited connection, less idle table activity, shorter journeys from a row to its data, more visible faces in creator strips, and details responding to clicks even after a long session. These are improvements observed in specific scenarios; I do not have conversion or retention measurements that attribute a business outcome to them.
The September 21 meeting notes record substantial improvements shipped between Friday and Saturday, especially on mobile. They also note that resizing the cryptocurrency table remained heavy and was only partially optimized. That qualitative feedback complements the traces; it does not replace measurements or close the remaining work.
Concrete tasks remained: complete the cold-start comparison across all three connection profiles, continue investigating residual table cost, revisit avatars that still failed to load, and obtain a comparable final search measurement. The notes also propose updating benchmark rules and resuming nightly optimization once the changes are stable; that is a next step, not an outcome of this chronicle.
The practice I want to keep is following the journey from intent to usable information, measuring under the conditions that expose the problem, and testing each assumption against evidence. Dan's and Joe's feedback helped determine where to look; product decisions and repeated tests determined what to change, retain and revert.
September 22-23: defining green with field data
The following days turned the sprint into a standing loop with one explicit goal: get the whole app green on Core Web Vitals without degrading the experience. Two things changed in how I work it.
First, the definition of green moved to field data. The lab runner with throttled CPU exaggerates; what counts now is the 75th percentile of real users. That reframing immediately named the worst page: topic and asset detail pages, red on all three metrics in the field, with interaction latency far above the green threshold on desktop.
Second, promotion became part of the loop. Over these two days I promoted several verified batches from staging to production through selective cherry-picks, each gated by the full test suite, local smoke runs against the production build, and post-deploy smoke checks, then measured again in production rather than assuming the staging numbers carried over.
The work that shipped, in the order it happened:
Removing forced layouts from the tables. Profiling found the category table observing its whole subtree and re-reading geometry after every batch of cells (over a hundred full-page forced layouts per mobile visit), and the creator strip measuring every avatar in a layout effect. Narrowing the observation and replacing measurement with arithmetic eliminated the forced-layout time almost entirely. Category click latency itself did not move measurably; the dominant remaining cost is React rendering the new table inside the click handler.
Field attribution for the slow metrics. The web-vitals tracking now reports, for every non-green sample, which element produced the LCP, which interaction and phase produced the INP, and which element shifted in CLS, by page group, device and plan tier. Within days, real-user rows will say which interaction actually causes the red desktop interaction latency, instead of guessing from lab traces.
The detail chart was remounting every bar on every render. The charting library remounts all bars when its series props change identity, and a correlations hook was creating a fresh series on each render, so hundreds of bars were rebuilt with no visible change on every tab switch, poll or late fetch. Memoizing two hooks cut tab and settings interactions from roughly 300-350 ms to under 100 ms on desktop, measured in staging and then confirmed in production.
One rectangle per bucket instead of one per row. The chart drew a component per data row (several hundred in the longer ranges), and range changes rebuilt them all. A new layer draws social buckets as one rectangle per run of equal values and the volume strip as a single path with the exact original geometry, with an invisible series preserving axis domains and the tooltip. Pixel parity was verified before promoting: the volume strip byte-identical, the main chart differing only in the hairline seams between equal sub-bars that the design had wanted merged anyway. Range changes got 15-35% cheaper, most in the row-heavy ranges, confirmed in production.
The mobile LCP was a watermark image. On mobile detail pages the largest element was a watermark graphic that could take five to nine seconds on slow connections. It is now inline SVG, the LCP element becomes the hero text, and the hero's data seed falls back to before the closing body tag when the upstream is slow, so the hero still paints with numbers on first render.
Two smaller lessons stayed in the notes: guest sessions cannot measure the detail chart, because non-default ranges are gated behind an upgrade overlay: afternoon guest measurements were measuring the overlay, not the chart; and topics without a price were never the problem, the weight is on coins and stocks.
Detail pages are still not green in the field: the interaction and layout-shift work now waits on the attribution rows arriving from production, and the remaining LCP work is structural: seeding the snapshot headline from the edge and the guest stock price are the next levers, in that order.
Later on September 23: the first structural lever ships
The two levers became tickets and went to Hangar, the agent platform, first. Neither came back: one failed without a recorded reason, and the other was rejected twelve times by the router as out of scope before I clarified the description. That is a data point about delegation, not a judgment: structural performance work that crosses the data layer still routes poorly. I took both myself.
The snapshot headline seed shipped end to end. On desktop the largest visible element is the snapshot text, which used to wait for the client to fetch it. Seeding it from the edge inside the first render removed the skeleton phase entirely: in staging, the headline painted at 1.9 seconds with layout shift dropping from 0.060 to 0.006, where the previous build showed bars at 4.5 seconds, text at 8.2, and a 76-pixel chart jump. Promoted to production with the usual gates and measured again there: guest snapshot text went from 3.3-3.6 seconds to 1.6-1.9. While the gates ran, production moved under me (the checkout fix from the support session landed first), so the batch was rebased and re-verified rather than forced.
The second lever, the stock price for guest sessions, was in progress at the close of this edition. The before measurement makes the target concrete: the detail page mounts at 1.79 seconds, at 1.91 it collapses back into 88 skeletons when it identifies the topic as a stock, and the price appears at 2.31. That 400-millisecond window of undoing is what the seed should remove. The seed itself was verified in staging with ticker, price and asset binding; a header preview went up behind it, and the frame-by-frame comparison against the previous build was still running when this was written.
Closing September 23: the second lever, the chart window and the shifts
The night of the 23rd closed the batch that was open when the previous section was written, and two more went out behind it.
The guest stock price seed shipped (DEV-12804). The 400-millisecond undo window disappeared with the whole skeleton phase around it: measured in production at CPU 4x, the chart header price now paints with the page instead of with the chart, guests going from +609 to +880 ms after mount down to +114 to +139, and paid sessions from +1417 to +1813 ms down to +149 to +183. The frame comparison that was still running at the previous edition's cutoff confirmed the seed before promotion.
Then the window between page mount and the chart's first draw got its own ticket (DEV-12807). Four causes, none of them the chart itself: the actions bar measured itself once per header render instead of once per frame, the analytics library loaded before the page was interactive, signed-in visitors parked a seeded asset series in the head they would never use, and the tab strip repeated the same measurement pattern. After the batch, chart-after-mount went from +785 to +946 ms to +535 to +764 for guests, and from +928 to +1201 ms to +613 to +954 for paid, in production at CPU 4x.
The last promotion of the day attacked layout shift (DEV-12809). Below-fold sections were shifting the page as they came into view, and the diagnosis had a satisfying wrongness to it: every near-viewport observer used the browser viewport as its root, but the app scrolls inside a workspace container, so the observers' early-reveal margins were clipped away and nothing ever revealed early. Pointing the observers at the scroll container, measuring and holding section reservations, and keeping the word cloud's box while it loads took scroll CLS on staging from 0.11 to 0.14 down to 0.000, guest and paid. The field impact reads in PostHog over the coming week.
By the end of the day the deployment record for the three days counted 21 production deploys, all green, with smoke tests after each. Observability also grew a hand: a trace now fires when a category tab goes blank, with a skeleton painted meanwhile, which is the instrumented answer to a support mystery from the same morning where a blank tab on one phone could not be explained because it left no trace.
The loop continues; this chronicle now stands at the end of September 23, with the field attribution rows accumulating and the below-fold CLS fix waiting for its week of production traffic.
Working sources: September 8-20 investigations and verification records (DEV-12555, DEV-12732, DEV-12736, DEV-12737 and DEV-12781), the September 19 performance audit, change history and September 21 meeting notes; September 22-23 work-session records for the webapp-green loop (DEV-12795 and subsequent performance batches, then DEV-12803, DEV-12804, DEV-12807 and DEV-12809), the production deployment record for September 21-23, including staging and production measurements and promotion gate logs. Feedback attribution comes from the investigation records. Figures retain their environment and test conditions; complete records remain in the project's private archive.
This entry is part of the LunarCrush rebuild.