LunarCrush Trading Bot
LunarCrush · Builder · Dec 2025, four days · Experiment
An internal competition to build a trading bot on Hyperliquid using LunarCrush's social metrics. Started strong, the market turned, and I lost half the pot — but walked away understanding our own data from the inside.
The brief
Internal competition at LunarCrush, December 2025. Each team member got four days and $1,000 USDC on Hyperliquid to build an automated trading bot that used our own social-intelligence data as its signal source. Vibe coding, no stack prescribed, no mandatory architecture — ship whatever you can in the time you have. The bot with the highest ROI at the end wins.
The point of the exercise was less "let's find alpha" and more "let's force everyone on the team to use our product as a trader would." You can't really sell social-sentiment data to crypto traders unless you've tried to extract money from it yourself.
What I built
A Python 3.11 bot with three complementary strategies, each tuned to a different LunarCrush metric:
Social Momentum Scalping (40% capital, up to 5× leverage). Watches for explosive spikes in social_volume and interactions — the idea being that social attention often front-runs price on smaller caps. Entry conditions: social volume change ≥ 40%, sentiment ≥ 60, 1h price already ticking up. Targets +6%, stops at -2.5%, 1–4h hold.
AltRank Breakout Hunter (30% capital, 4× leverage). Scans the top 100 coins for fast improvements in LunarCrush's AltRank — proprietary metric that combines social + market signals. A coin jumping 20+ ranks in a short window often signals rotation. Targets +12%, stops at -3.5%, 2–8h hold.
Galaxy Score Reversal (20% capital, 3× leverage). Looks for divergences: price down -5% in 24h but Galaxy Score (LunarCrush's composite health metric) still above 70. That's the setup of a healthy asset getting oversold. Targets +10%, stops at -4%, 4–12h hold.
On top of the strategies, three layers of risk control: per-trade stop losses, portfolio-level daily drawdown cap (-15%), and a systemic kill switch that flattens everything if API latency got weird or liquidity dried up.
The architecture ended up being a small data pipeline:
LunarCrush API v2 → Signal Engine (3 strategies) → Risk Gatekeeper → Hyperliquid SDK
Everything persisted to a local SQLite DB, with a Flask server exposing read endpoints for the dashboard and write endpoints for bot controls (pause, resume, stop, update strategy weights live). Deployed on Replit so it could run 24/7 without me babysitting a VPS.
The dashboard I didn't have to build
Here is the part I want to own honestly: none of the bot logic needed a UI. A log file would have been enough. The trades execute on Hyperliquid, the balance is visible in their own dashboard, the strategy parameters live in a JSON config file.
But I am a product designer. When I sat down to watch my own bot trade, I wanted to feel it — the scan cadence, the position entries, the PnL turning red, the win rate drifting. So I spent a disproportionate amount of time building a black-on-green Courier New terminal dashboard.
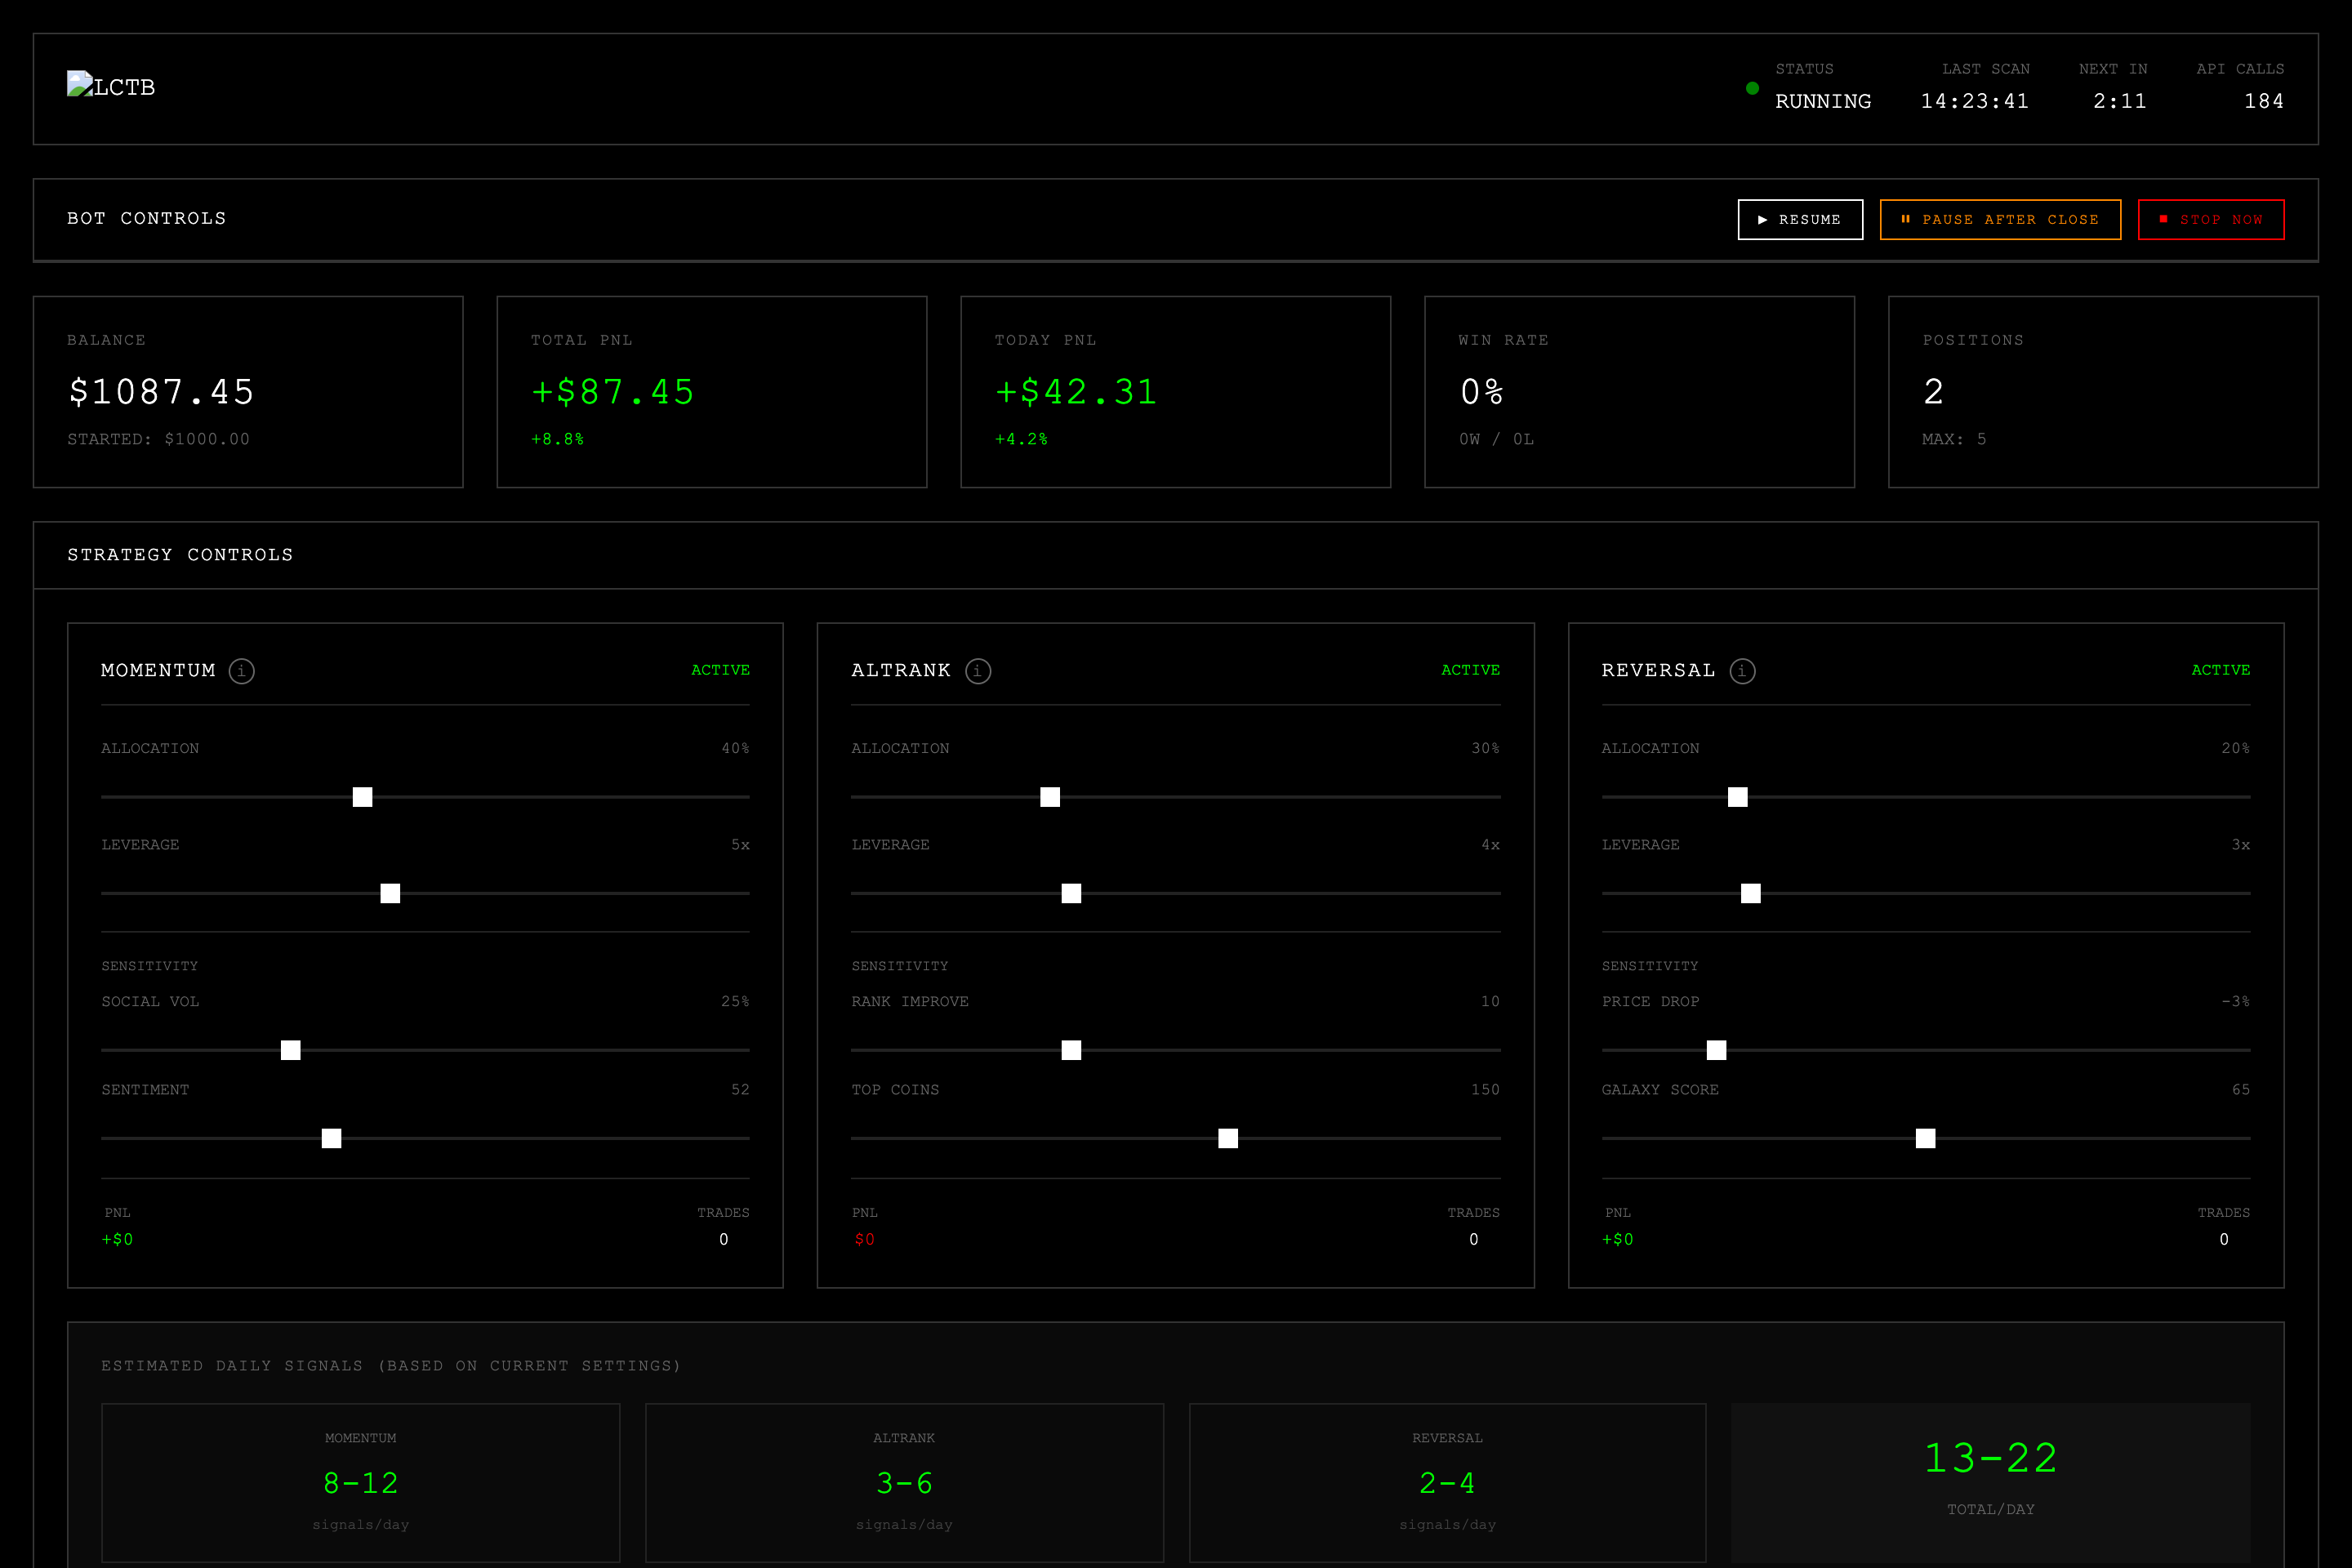
Top strip: bot status (running/paused/stopped) with a pulsing green dot, last scan time, countdown to next scan, cumulative API calls. Below that, three controls I wanted within arm's reach: RESUME, PAUSE AFTER CLOSE (finish open positions then stop), and STOP NOW (panic flatten).
Five metric boxes across the top: balance, total PnL, today's PnL, win rate, open positions. Numbers in monospace so they don't shift as values change — a detail that matters when you are staring at them refreshing every 30 seconds.
Below, live controls for each strategy with sliders for capital allocation, leverage, and sensitivity thresholds (social volume floor, sentiment minimum, rank improvement threshold, Galaxy Score cutoff). I built these as editable instead of read-only because partway through Day 1 I realised I wanted to be able to retune the bot without redeploying — that's a surprisingly common pattern once you are living inside your own tool.
At the bottom, the trade history table with strategy tagging per trade — the only way to answer "which strategy is actually making me money right now?" Export CSV / Daily Report buttons for the competition wrap-up.
What actually happened
Day 1. Good. Social momentum caught a FARTCOIN pump early, AltRank nailed a rotation into PENGU, Reversal closed a couple of wins on majors. Up ~$90 after the first session. Win rate sitting around 70%. I felt clever.
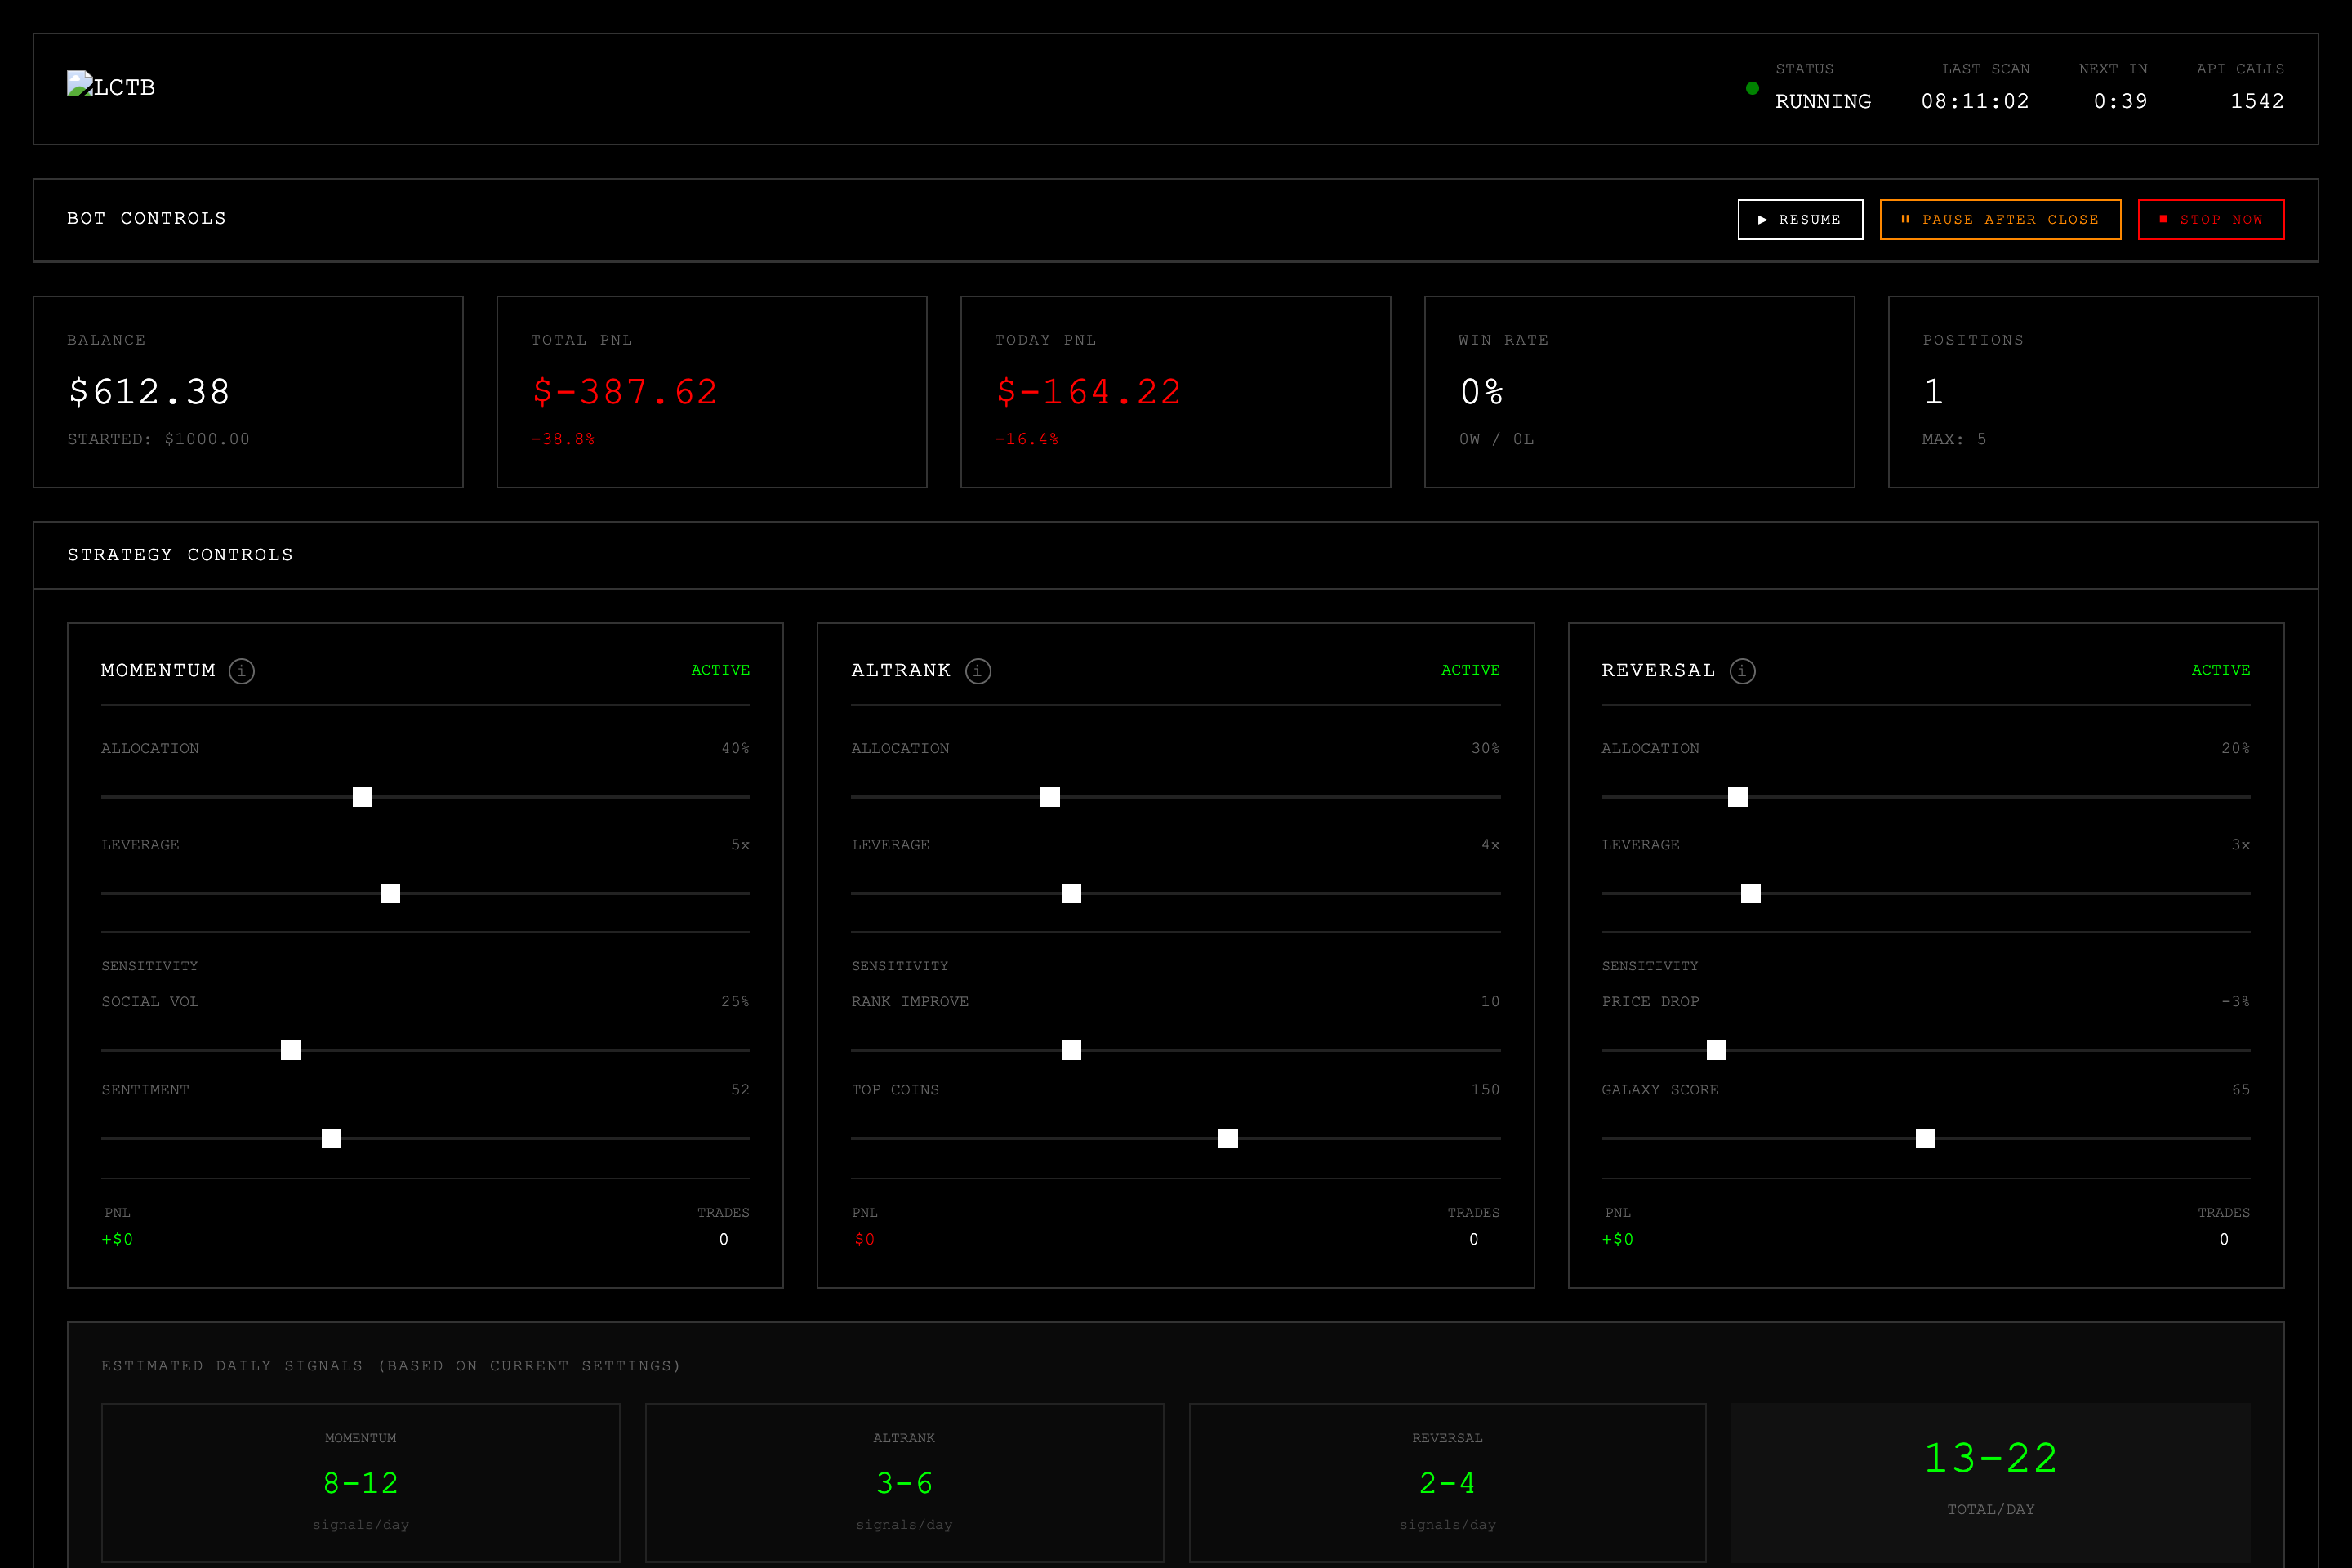
Day 2–3. The broader crypto market rolled over. This is the part no backtest prepares you for: when the whole market drops 8% in an afternoon, every one of your "social-driven longs" is a long that is bleeding. The momentum strategy kept entering — social volume was spiking, because everyone was panicking — but those spikes were no longer predictive of up moves. Positions hit stop losses in sequence. Win rate slid from 72% to 41%. Then into the 30s.
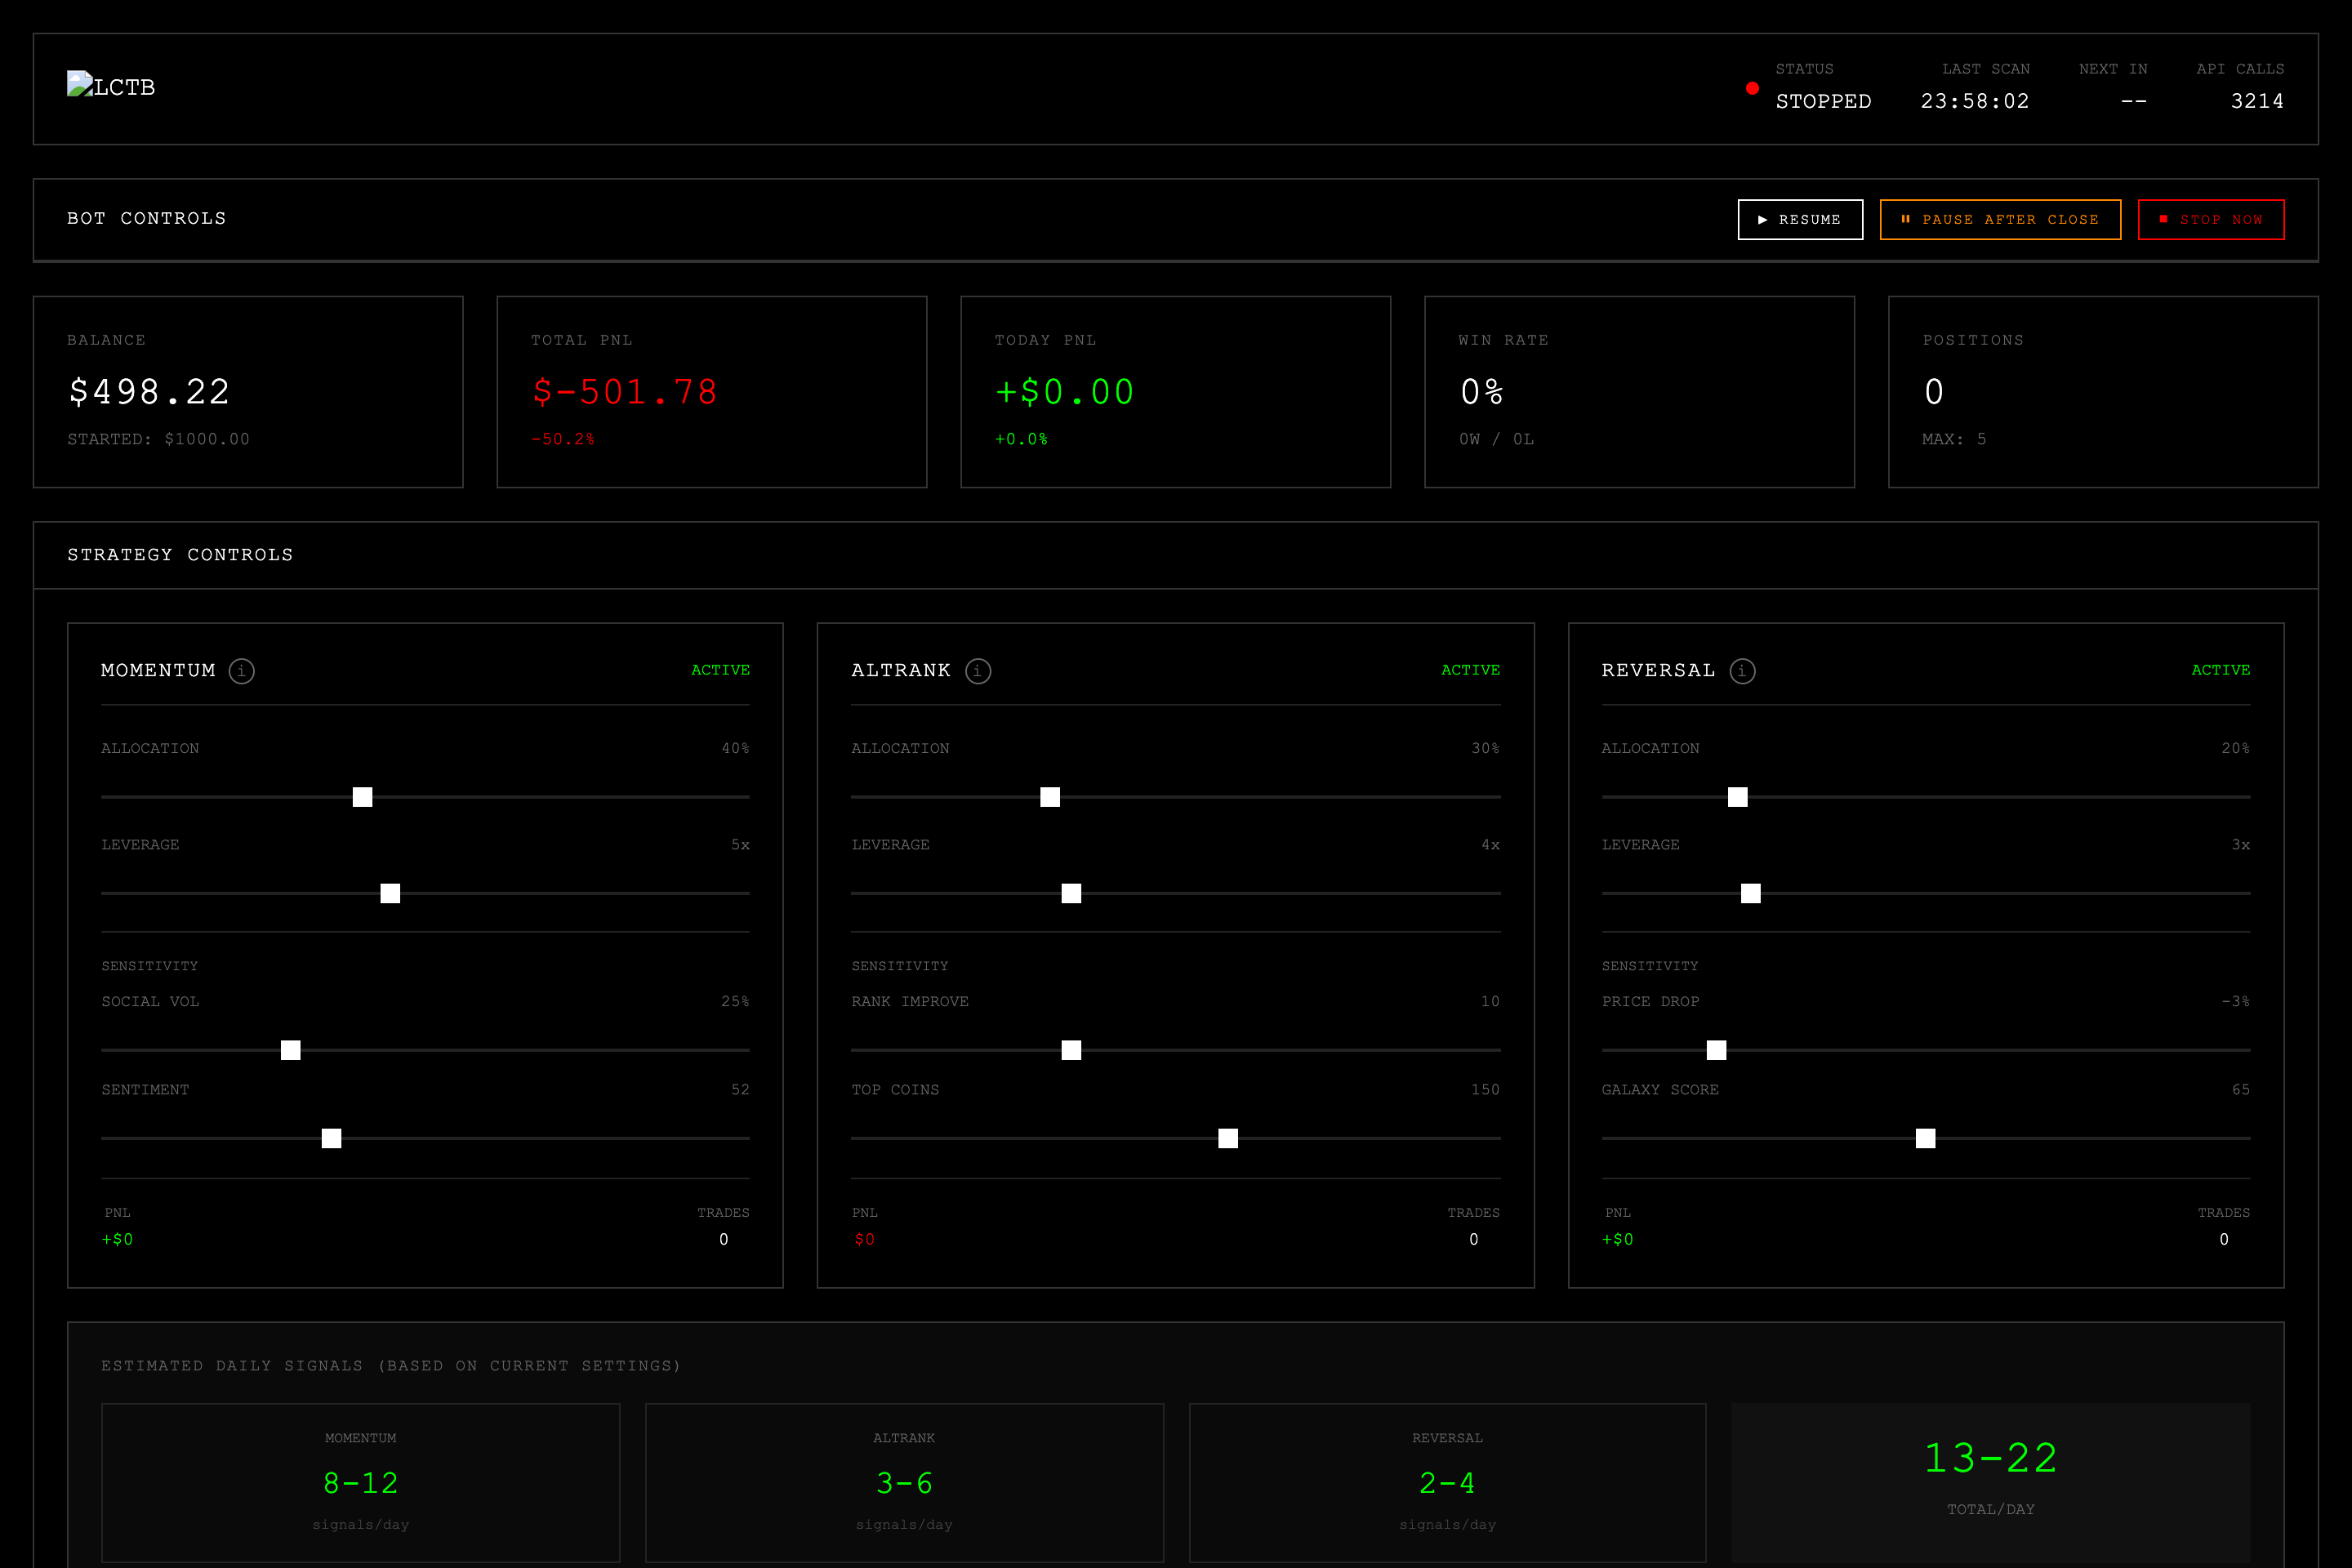
Day 4. I stopped the bot. Final balance: just under half of what I started with. Not the best finish. The winners of the competition were the ones who either (a) stayed in cash more, or (b) had strategies with shorter holds that were less exposed to the drawdown.
What the exercise was actually worth
Winning the competition would have been nice. Understanding the data I help sell every day was worth more.
What I learned about LunarCrush's data. Social volume spikes are not a clean buy signal — they are a "something is happening" signal. The sign depends on context the bot does not have. Galaxy Score is slower and more robust; AltRank is noisier but more interesting for catching rotations. When you try to price an API response in USD, you stop thinking about it as "metrics" and start thinking about it as "what is the shape of this signal."
What I learned as a designer. Watching a bot trade in real time is a fundamentally different UX problem than showing a chart of historical trades. You are not analysing — you are monitoring. You want to be able to glance at the screen and immediately know if something is wrong. That constraint pushed me toward: monospace numbers that don't reflow, green/orange/red at a language level (not decoration), controls that are always visible but visually quiet, no animations beyond a single pulsing status dot. I am going to steal this aesthetic for other tools.
What I learned about automated trading. Having three strategies is not the same as having three uncorrelated strategies. All three of mine were directionally long-biased on the same underlying: "social attention + LunarCrush metric = the asset goes up." When the market turned, they all turned together. A real portfolio would have needed at least one shorting strategy, or a regime filter that cuts exposure in broad downtrends. I did not have one.
What I learned about vibe coding. You can go from nothing to a multi-strategy live-trading bot with a dashboard in four days. The ceiling on what a single designer-with-LLMs can build has moved dramatically. What doesn't move is your ability to read market conditions — that is still pattern recognition earned slowly.
Stack
- Python 3.11 + asyncio (bot core)
- Hyperliquid SDK (perpetuals execution, non-custodial)
- LunarCrush API v2 (signals)
- SQLite (local trade history)
- Flask + vanilla JS (dashboard)
- Replit (24/7 deployment during competition)