LunarCrush 2026: The Design Underneath
LunarCrush · Head of Design · Feb to Apr 2026 · Shipped
A companion to the main product case study. The decisions behind the 700-pixel column, the topic-as-primitive architecture, and the system of components that lets the AI speak in the app's native voice.
LunarCrush correlates what the world is saying online with what is moving in markets. I have been Head of Design since January 2021. The main case study tells what the 2026 redesign looks like. This is its companion. The design decisions underneath. Why 700 pixels. Why one canvas instead of many pages. Why the AI renders in the same components the app already uses.
The data told us to stop
The rebuild started when I stopped trusting the metrics for what they seemed to say and looked at what they were telling me.
Monthly churn was running at 15.7%, more than twice the 7% threshold most B2B SaaS treats as critical. The acquisition funnel told the story underneath: 28,600 visitors landing, 6,900 signing up, 1,197 paying, and roughly 60 coming back. Acquisition was working. Retention was not. Half of our customers never touched the API; the half that did generated 5.4× more activity than the half living in the web app. The destination-website category in our space was already being absorbed by AI assistants, and the largest analytics destinations had begun pivoting in response.
The numbers were not saying iterate. They were saying that the entire category of destination websites is dying.
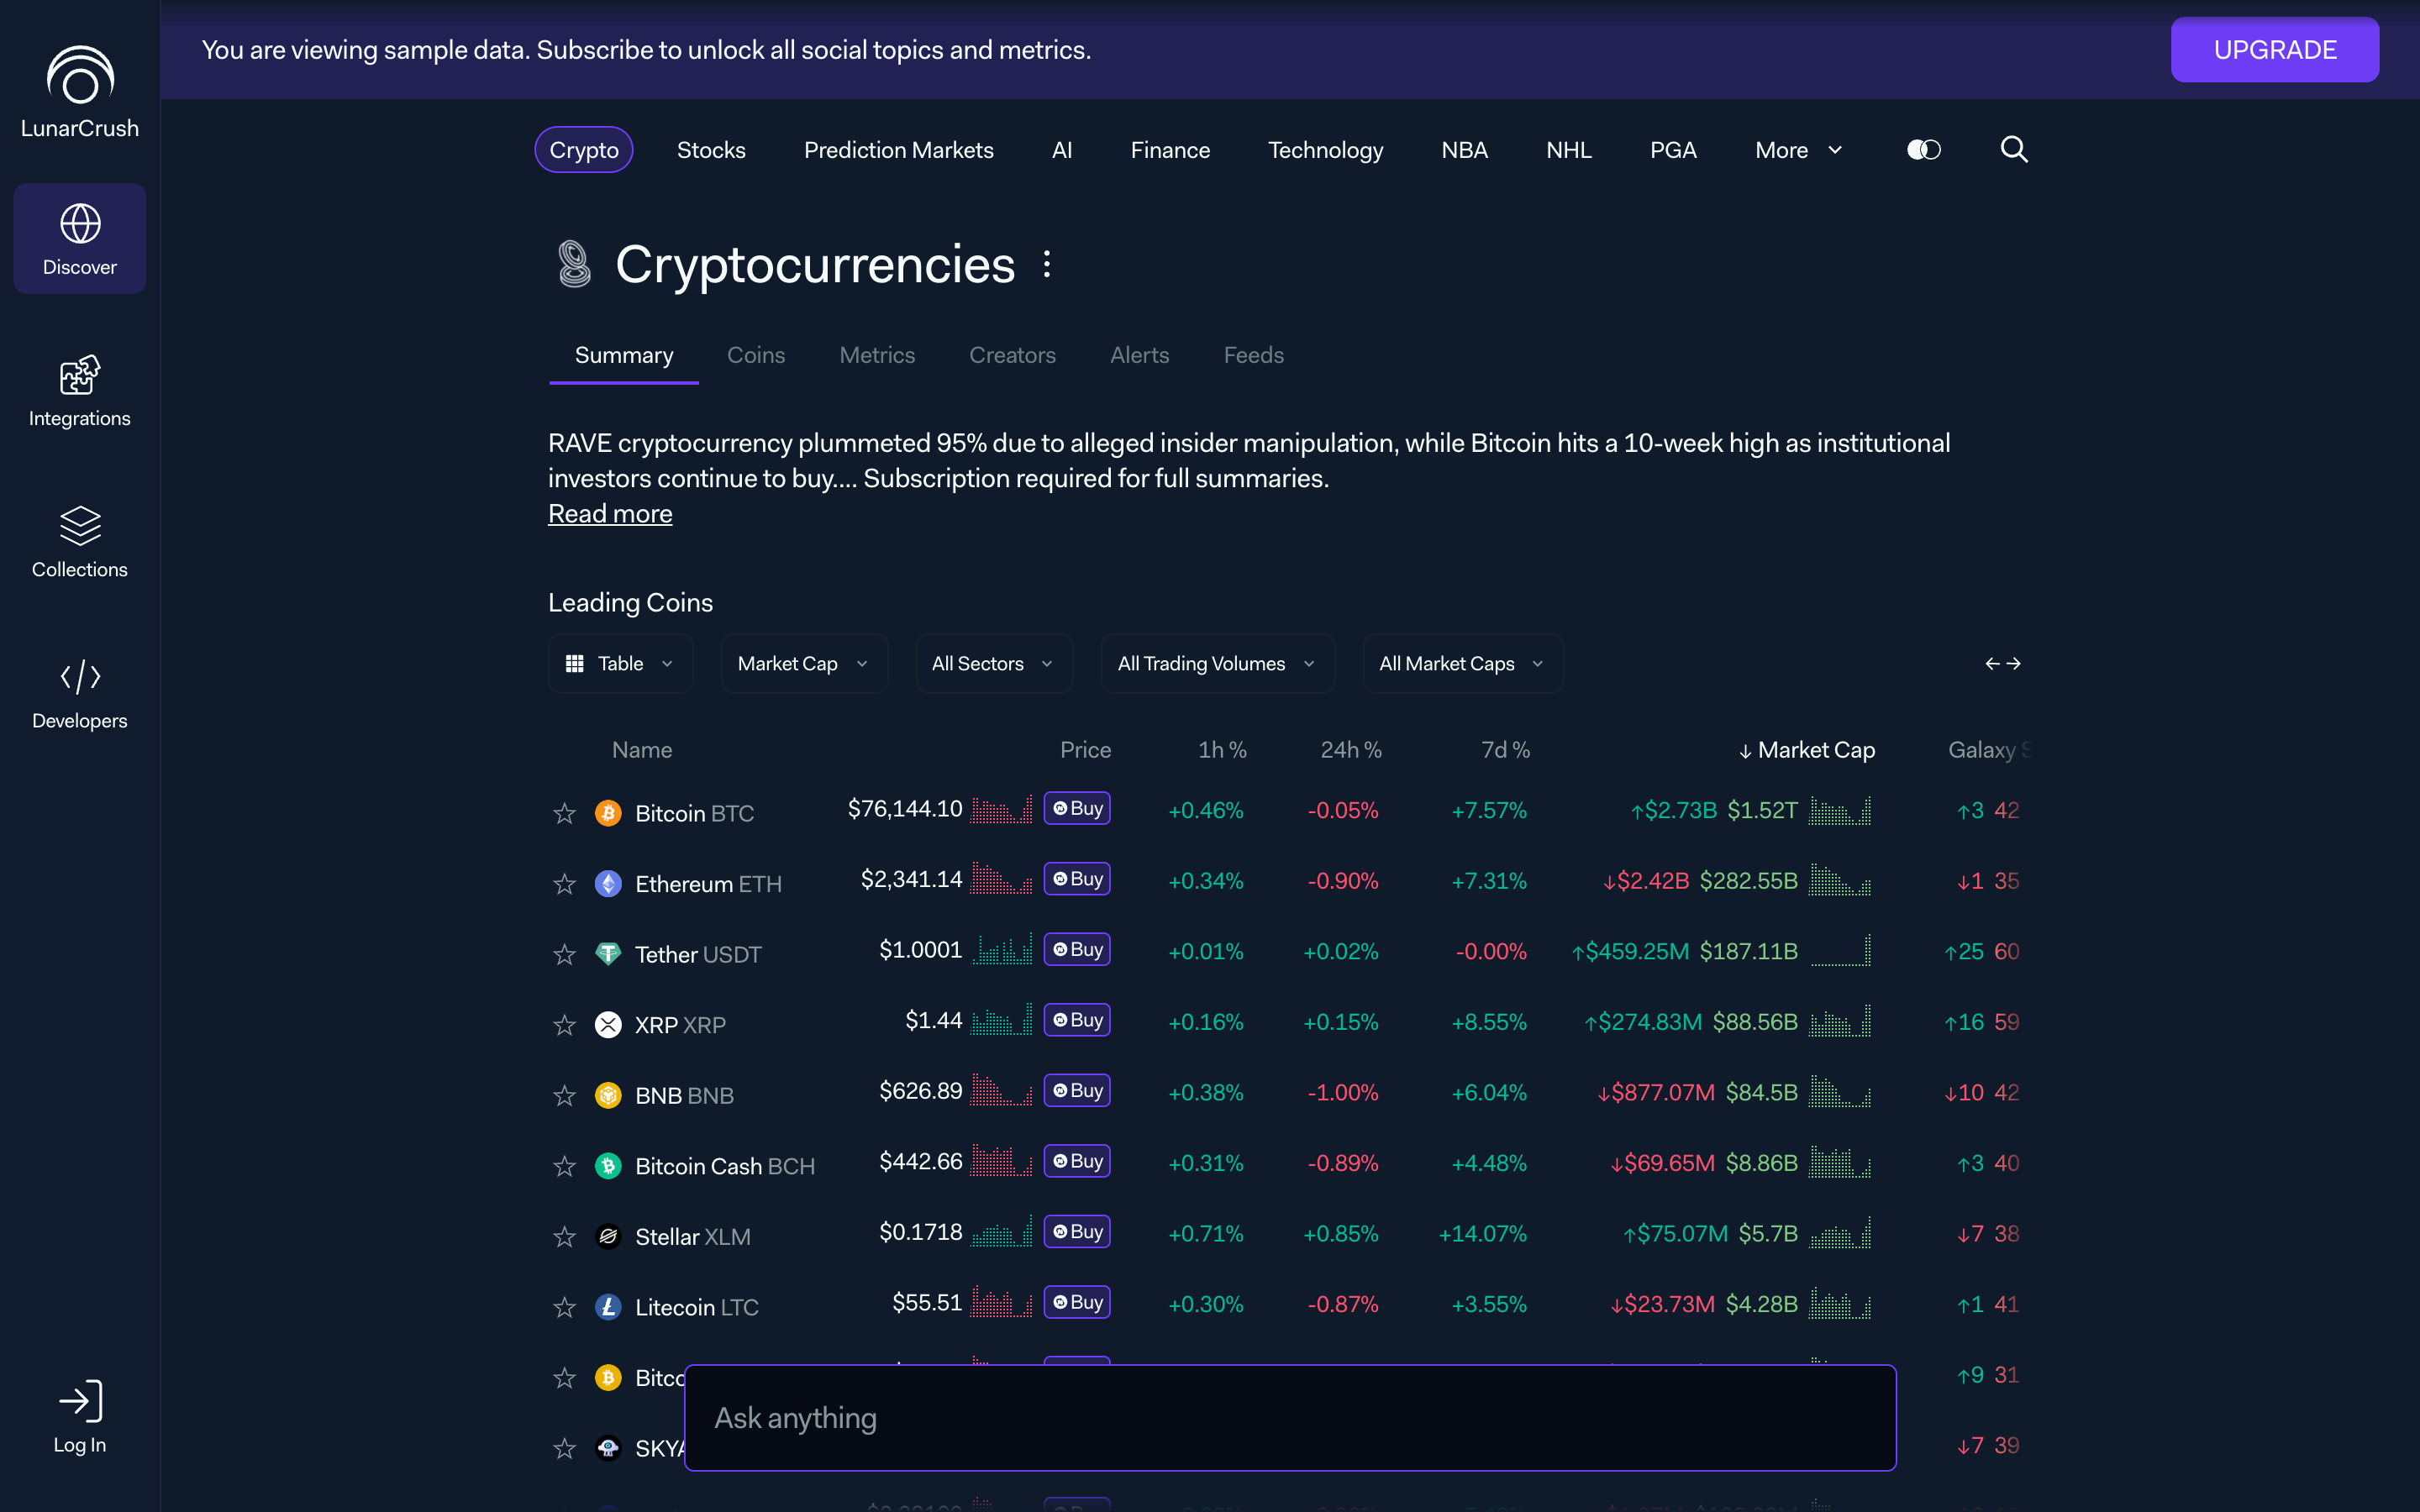
I took those data points into a week of working sessions with engineering, data, and leadership. The framing we landed on: users do not want another dashboard to configure. They want to ask questions and have the answer arrive composed. The product needs to meet them with that shape, or stop pretending it is a product people visit.
Everything that follows is a response to that framing.
One canvas, not many pages
The first decision was also the hardest. No more routing away from the main view. The app is a single workspace. Detail happens in modals, slide-overs and hover previews. Never a new page.
I broke the canvas into six layers, each one doing a single job:
- A ticker bar at the bottom, always visible, for market context that never needs a scroll.
- A left rail for asset navigation. Collections first (97% engagement among power users), then Recently Viewed, then Trending, then Favorites. Recognition over recall, in that order.
- A center stage that adapts to what the user is doing. Briefings, charts, topic detail, conversations.
- A right panel for agent activity and follow-up questions.
- An intent bar at the top for natural-language input. The thing that replaces dashboard configuration.
- A preview layer that opens on hover and click, keeping users anchored to where they started.
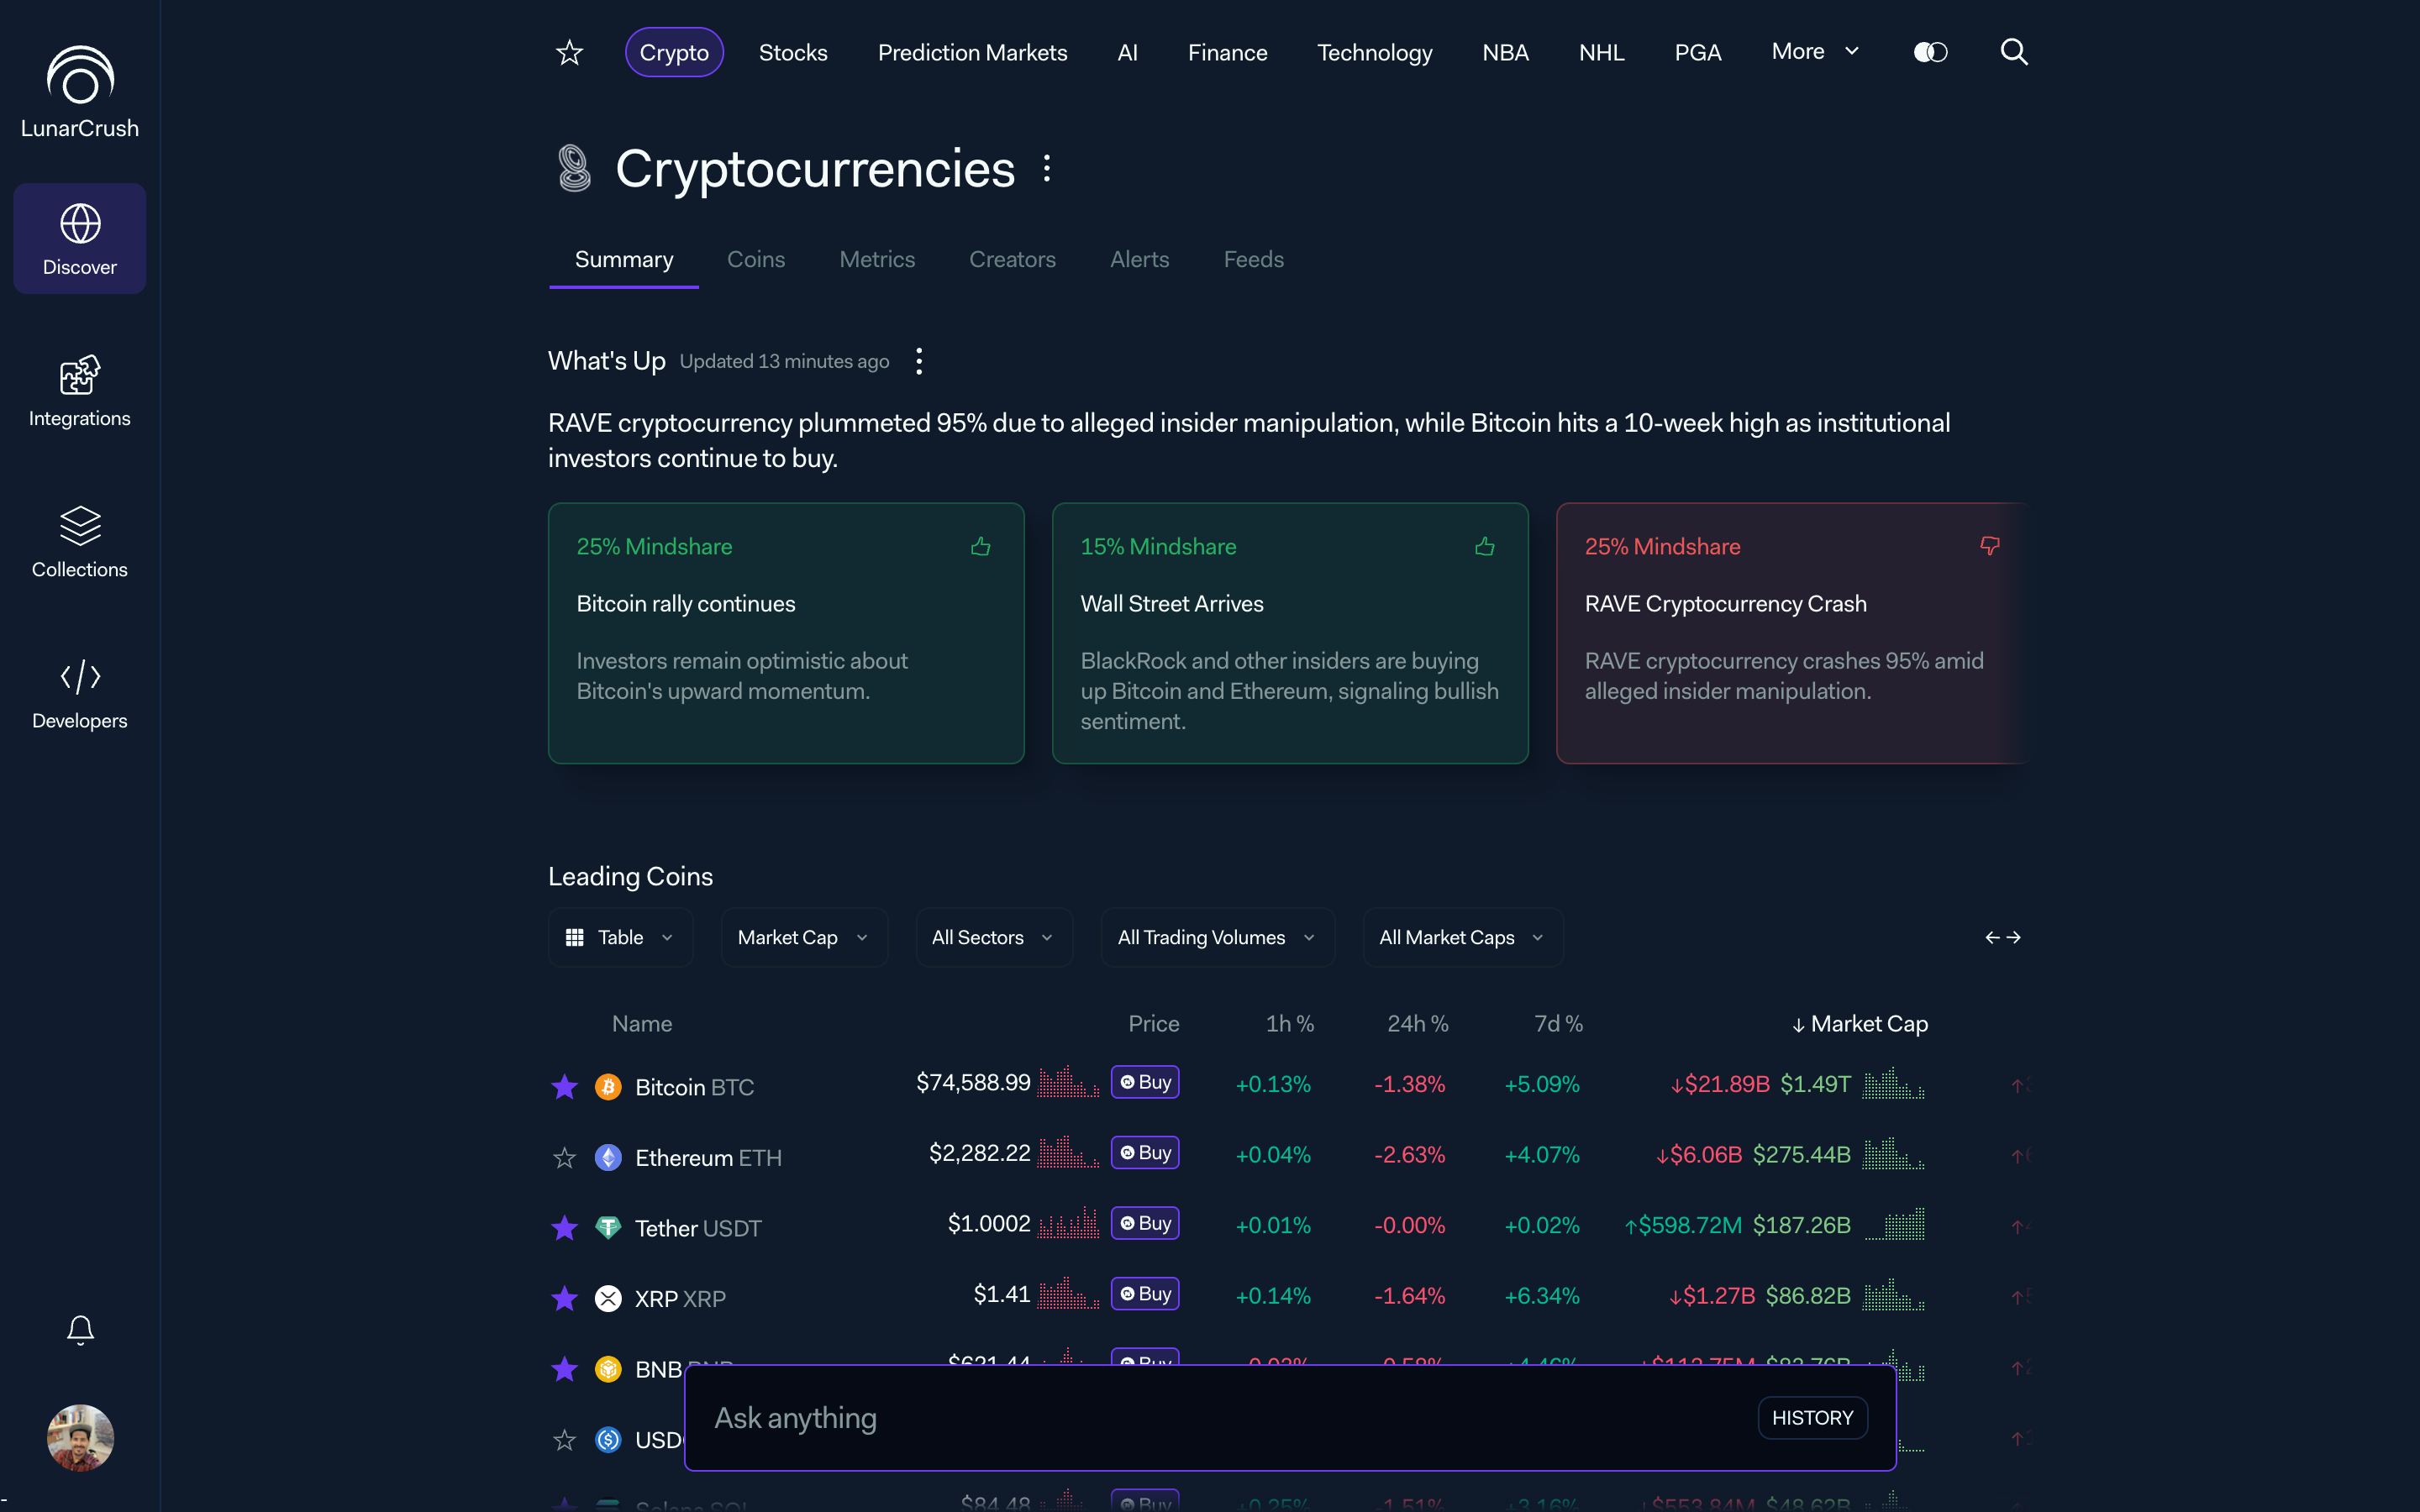
The architecture is not six features bolted together. Each layer is an answer to a specific failure mode of the old app. Hidden state is answered by the ticker. Abandoned discovery is answered by the rail. Dashboard fatigue is answered by the center stage. AI opacity is answered by the right panel. Manual configuration is answered by the intent bar. Context loss is answered by the preview.
When someone asks me why we did not ship a widget grid, the answer is that it would have brought every one of those failure modes back.
A 700-pixel line of sight
The most defended decision of the rebuild is also the most invisible one if you do not know it is there. Every main view holds a 700-pixel central column.
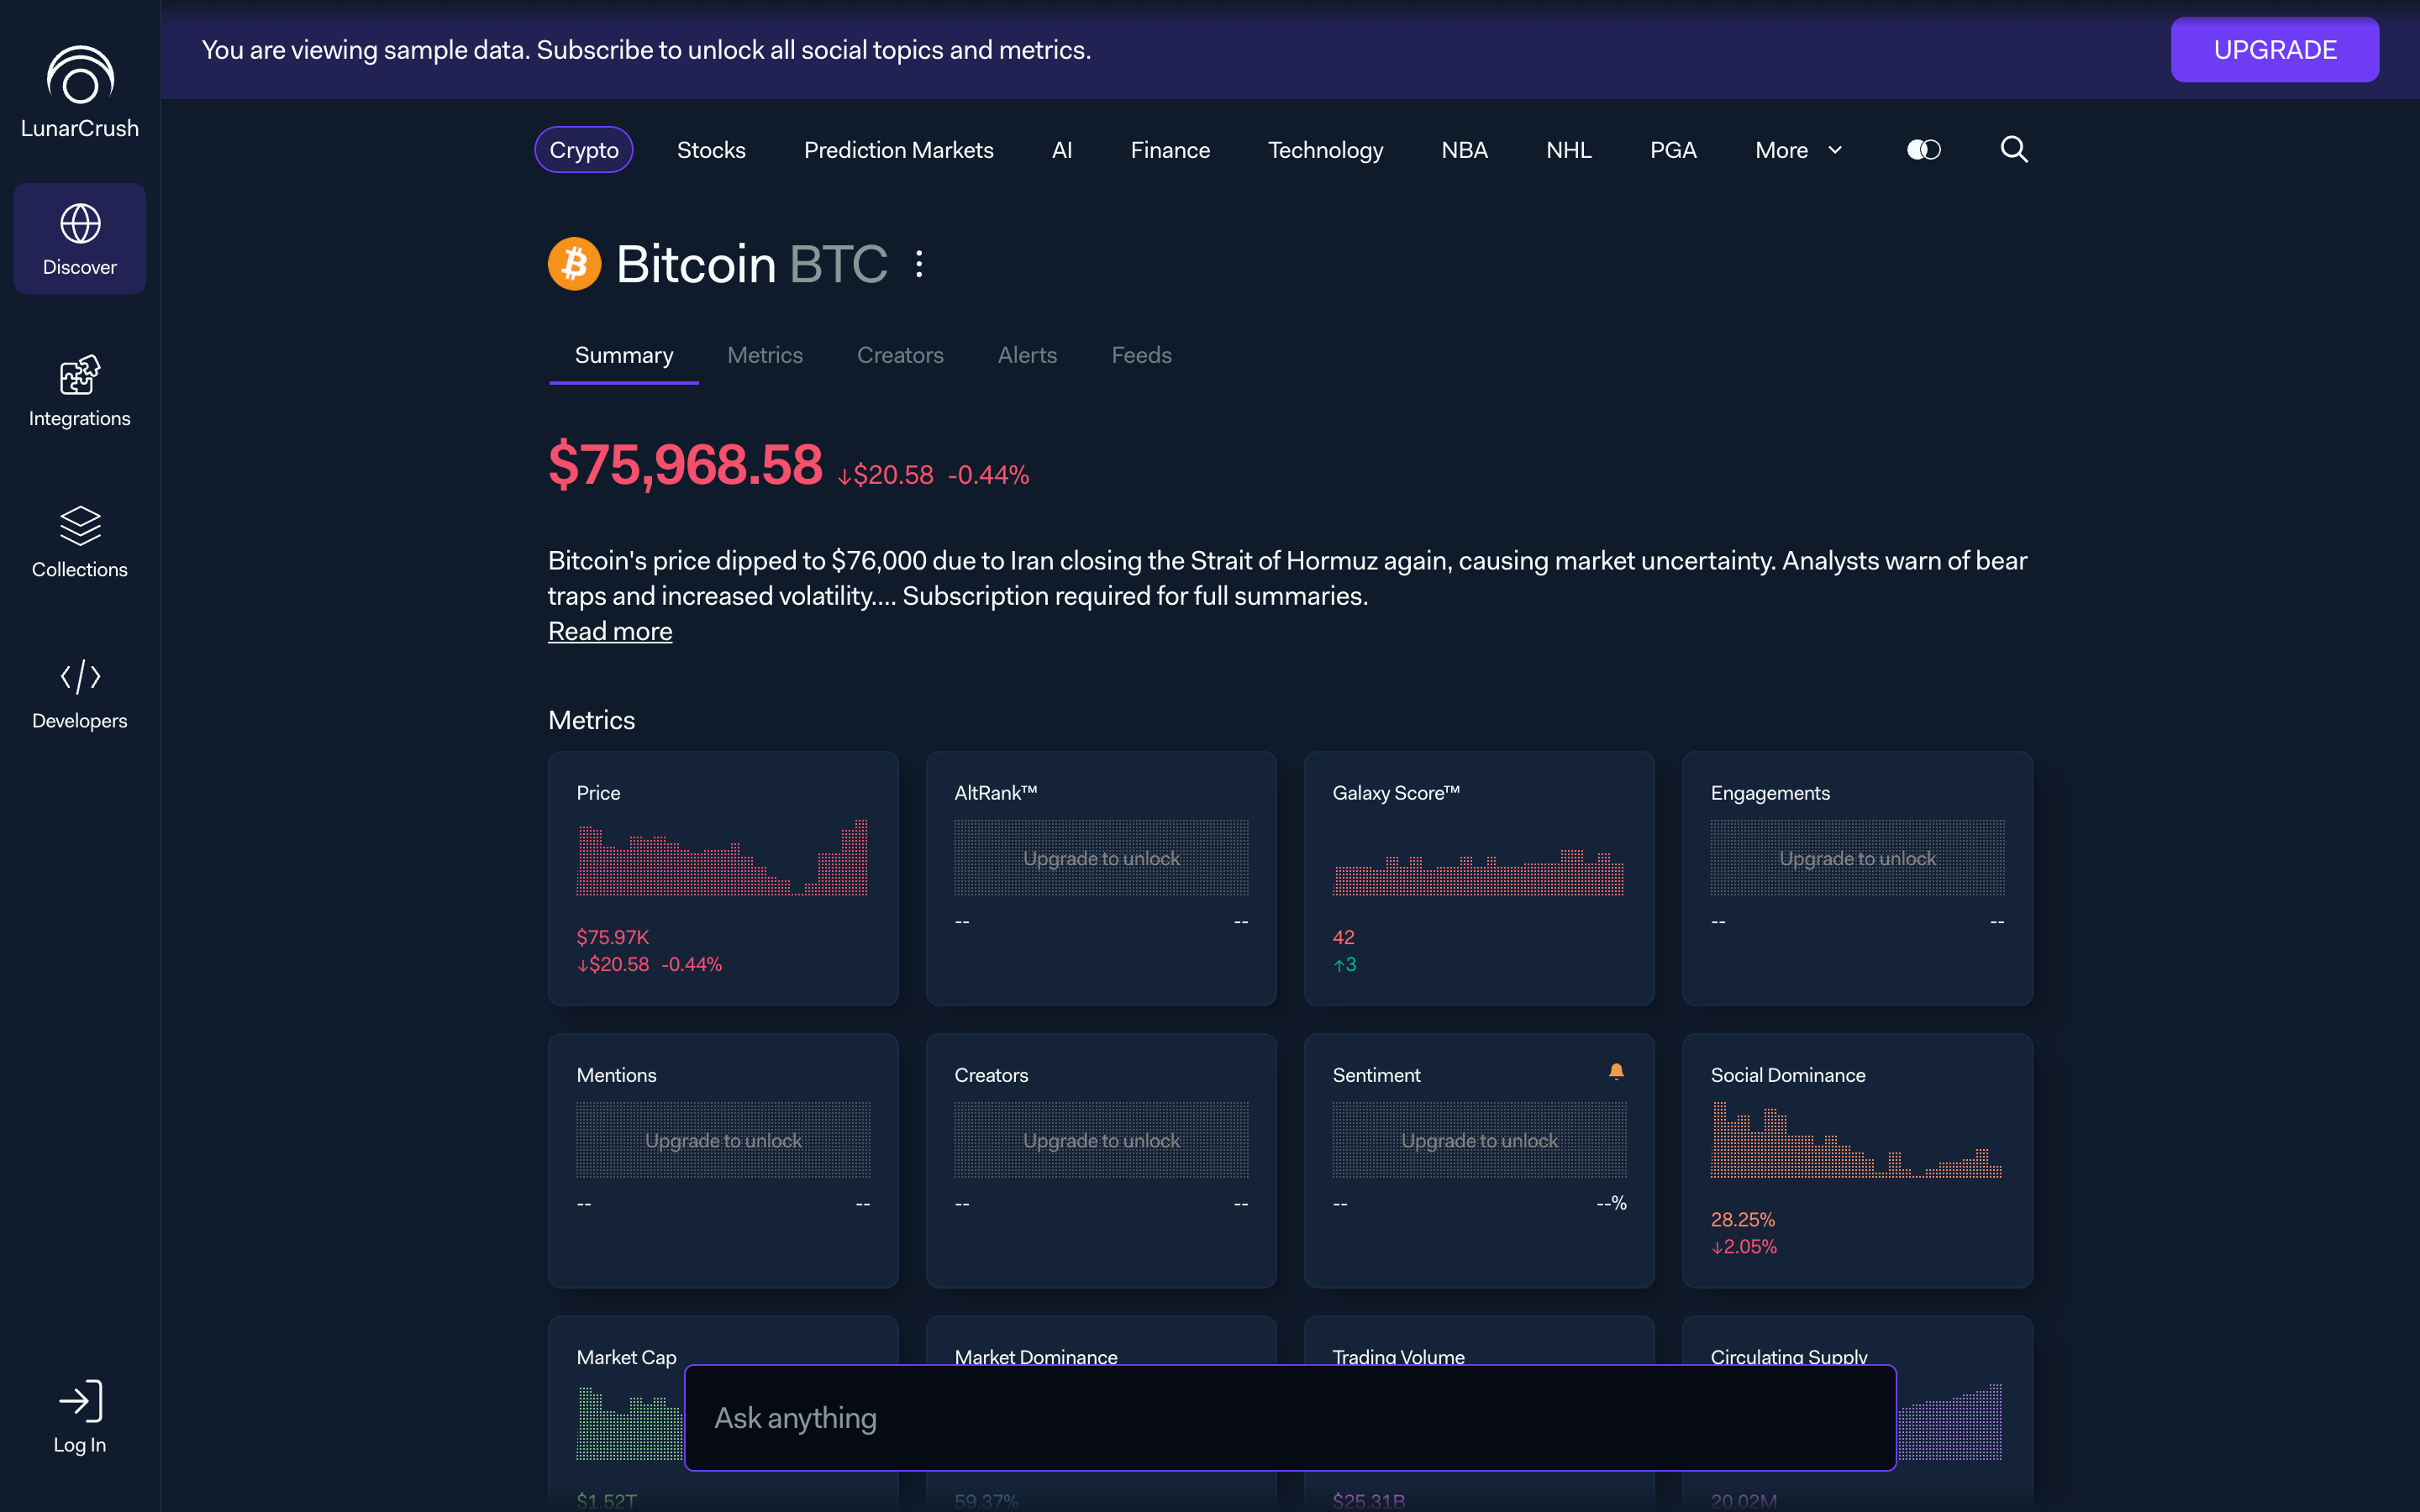
I committed to 700 pixels because of a very old piece of research. The comfortable reading range for body text is 50 to 75 characters per line. At our base font size and line-height, 700 pixels puts us inside that window with room for inline charts and component padding. Any narrower fatigues the eye. Any wider and the rhythm between text and embedded visualizations collapses.
More importantly, fixing the width fixed the center of gravity. The middle of every screen is now always in the same place. When I dropped the prompt field there, persistent on almost every page, it landed on a surface users already knew how to find.
I tested going wider on ultra-wide monitors. I tested adaptive columns. Every version made the AI conversation harder to read. The column stayed.
The topic is the primitive
The second load-bearing decision was what types the app knows about.
I collapsed them. Every object in LunarCrush is a topic. Assets, brands, people, events, categories, even predictions, all share the same schema, the same API, and the same six-tab set: Summary, Metrics, Creators, Feeds, Alerts, News. Only the header changes.
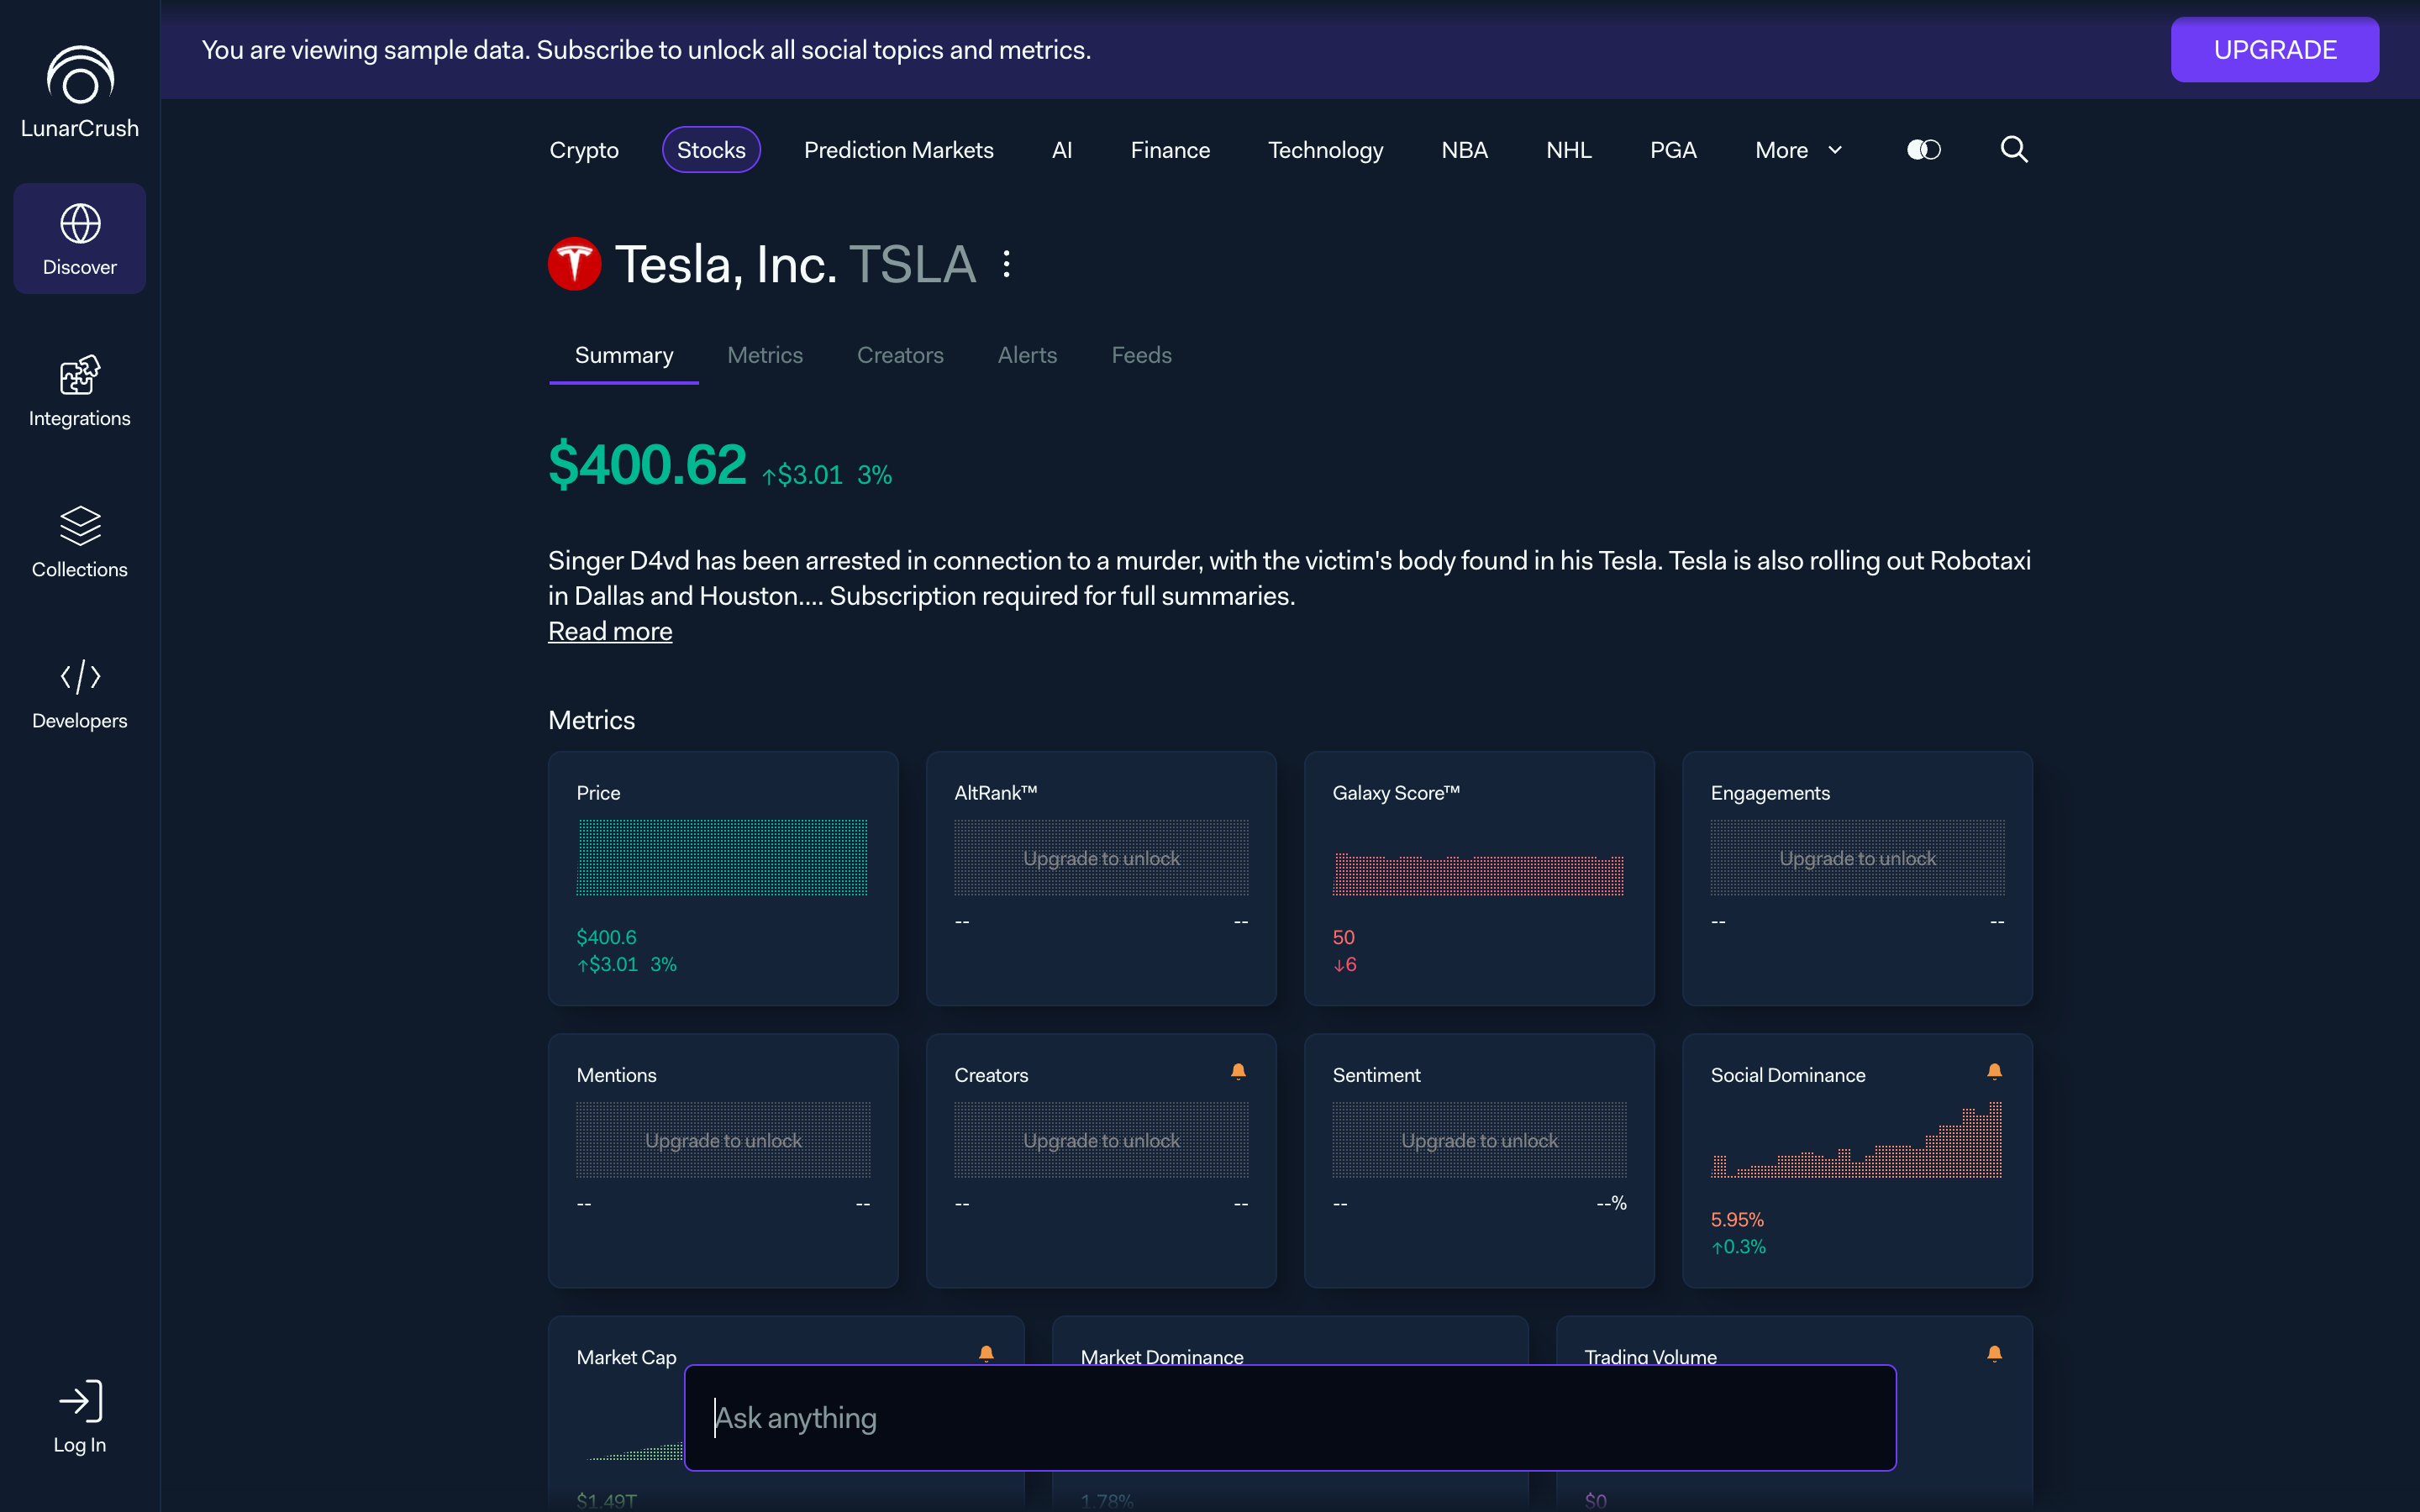
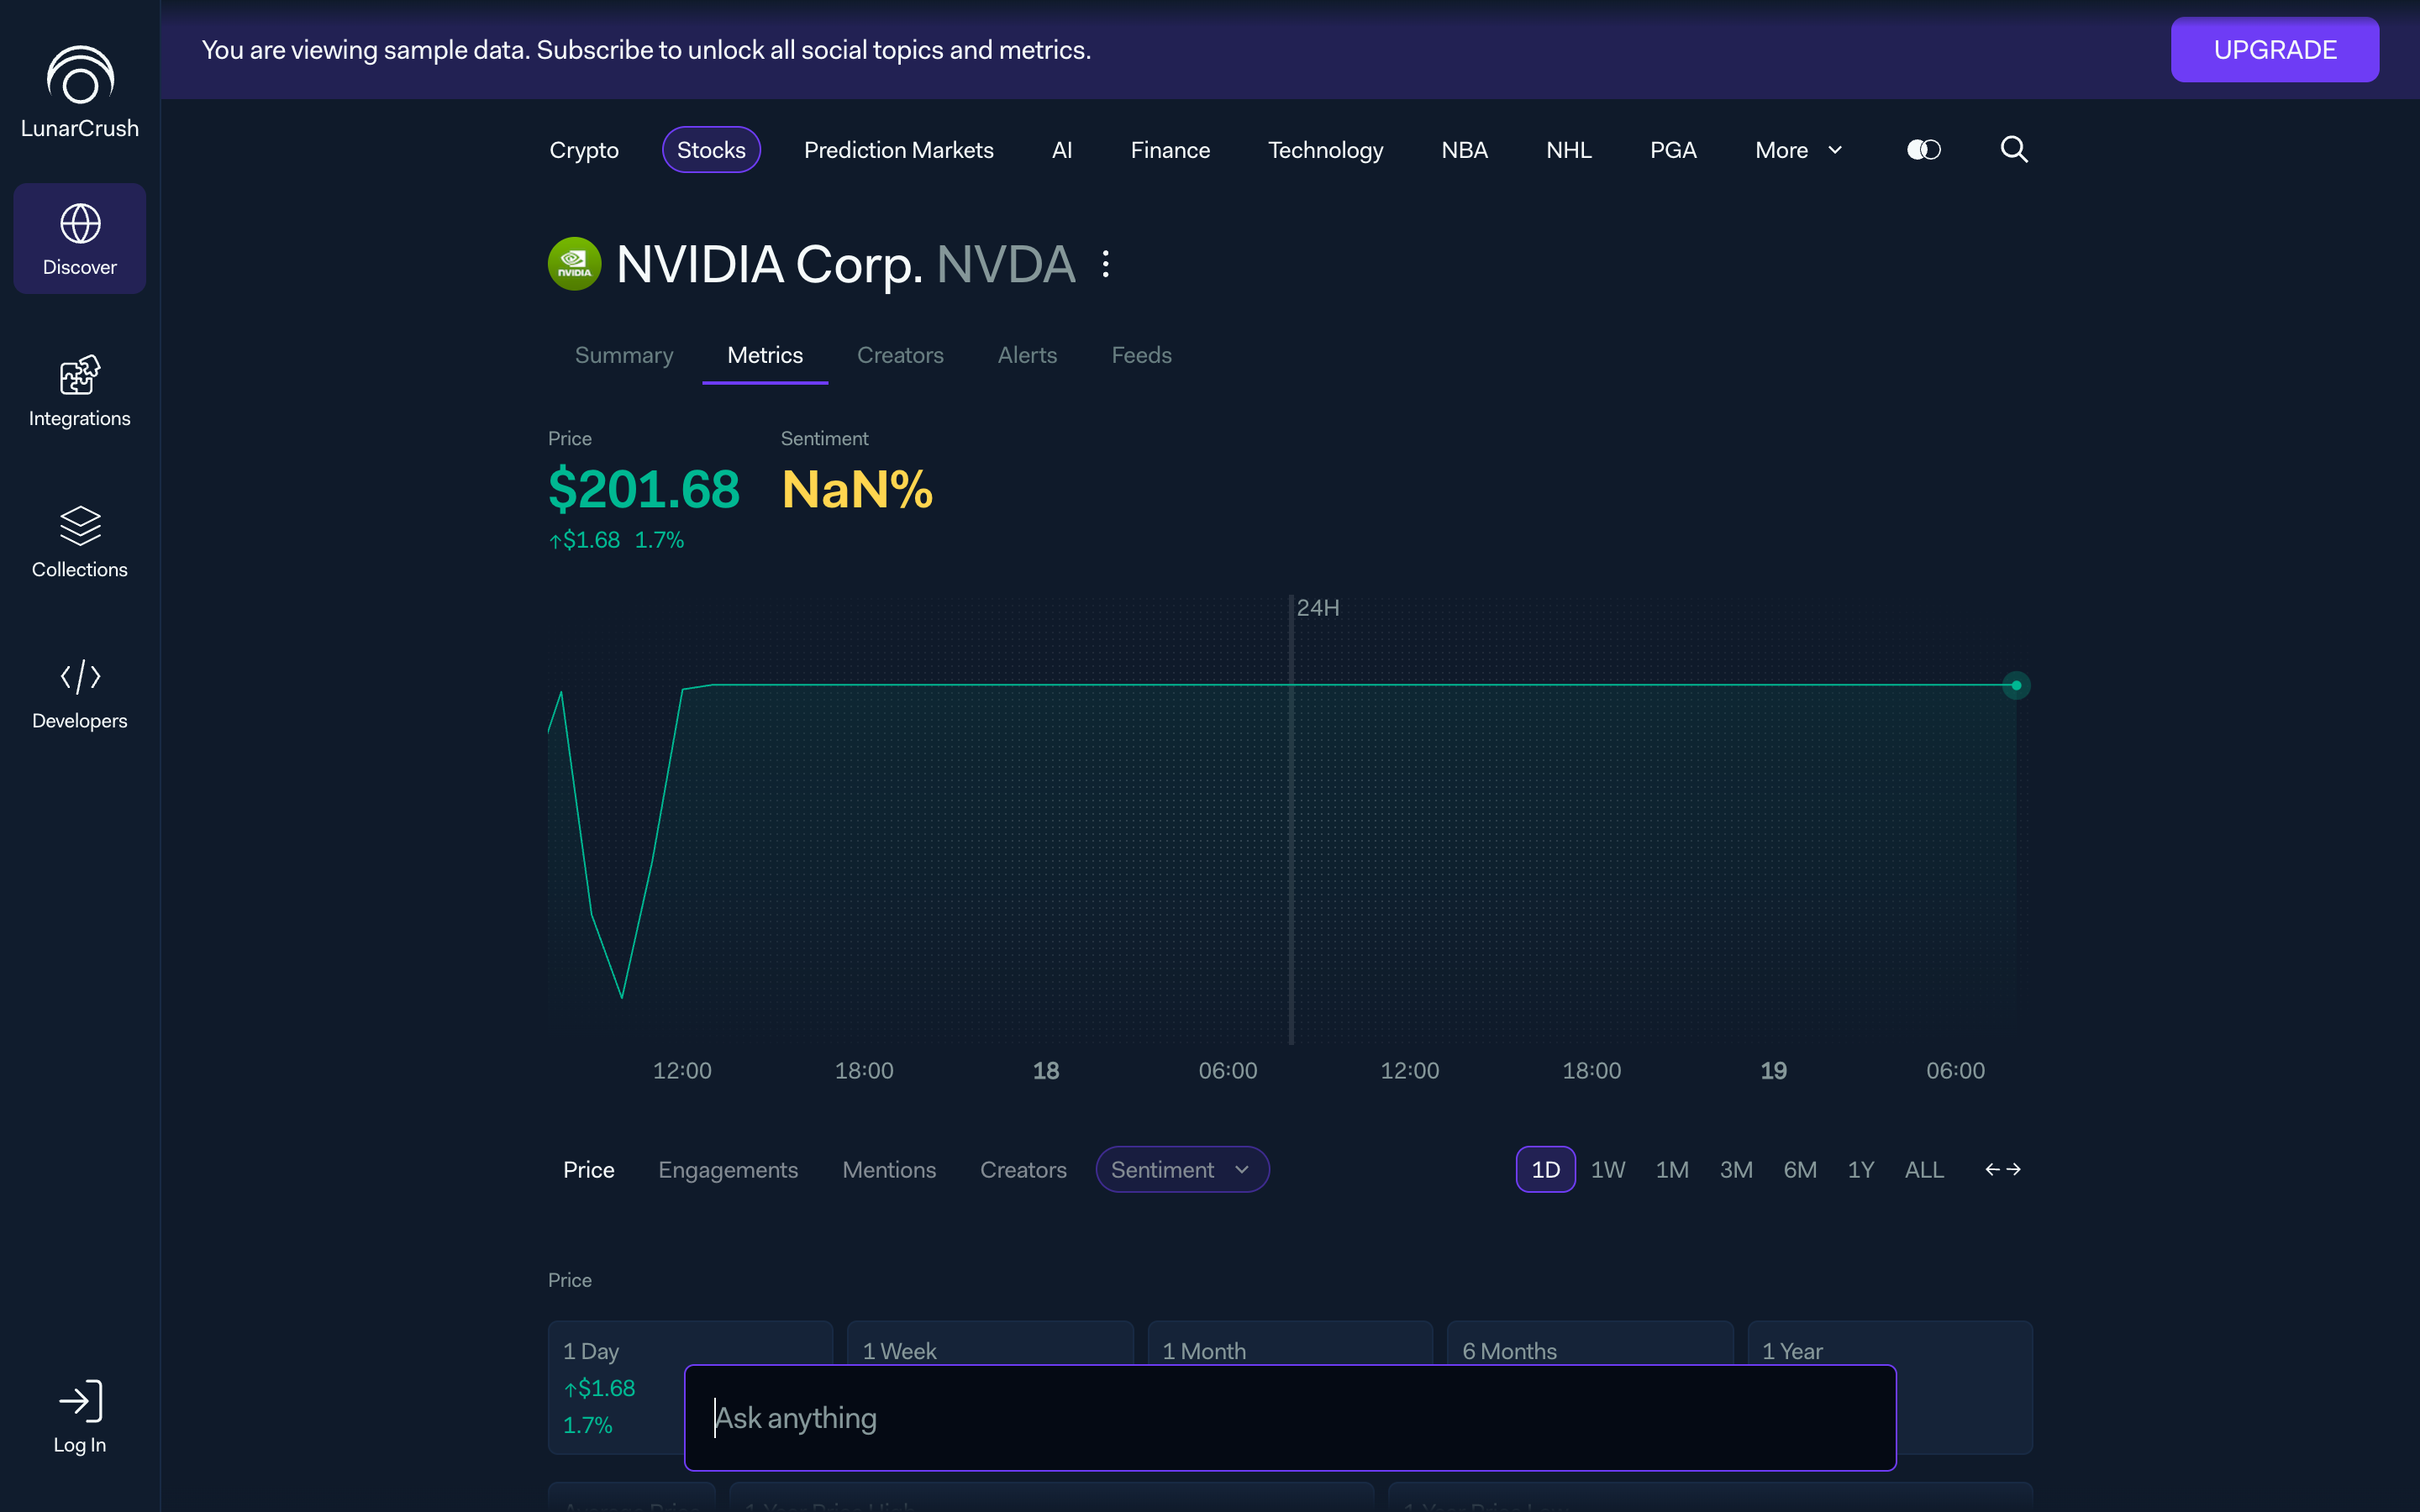
That consistency is not for elegance. It is for leverage. The data pipeline stops caring about asset type. The AI speaks one grammar. Every new vertical we ship, whether it is Premier League, a new prediction market, or a country, arrives into a product that is already designed. Only the data mapping and the header variant are new.
This is Nielsen's consistency-and-standards heuristic, but not in the decorative sense. It is consistency across real-world categories of things, not just across screens.
Density in layers, not clutter
The fastest way to fail a dashboard rebuild is to chase "more on screen" as a proxy for value. I went the other direction.
Density lives in layers. The first load shows enough to prove the product is useful: a summary paragraph, a single primary chart, a leading table. Everything else happens on reach. Hover for a preview card. Click for a modal with the full detail. Prompt for anything else.
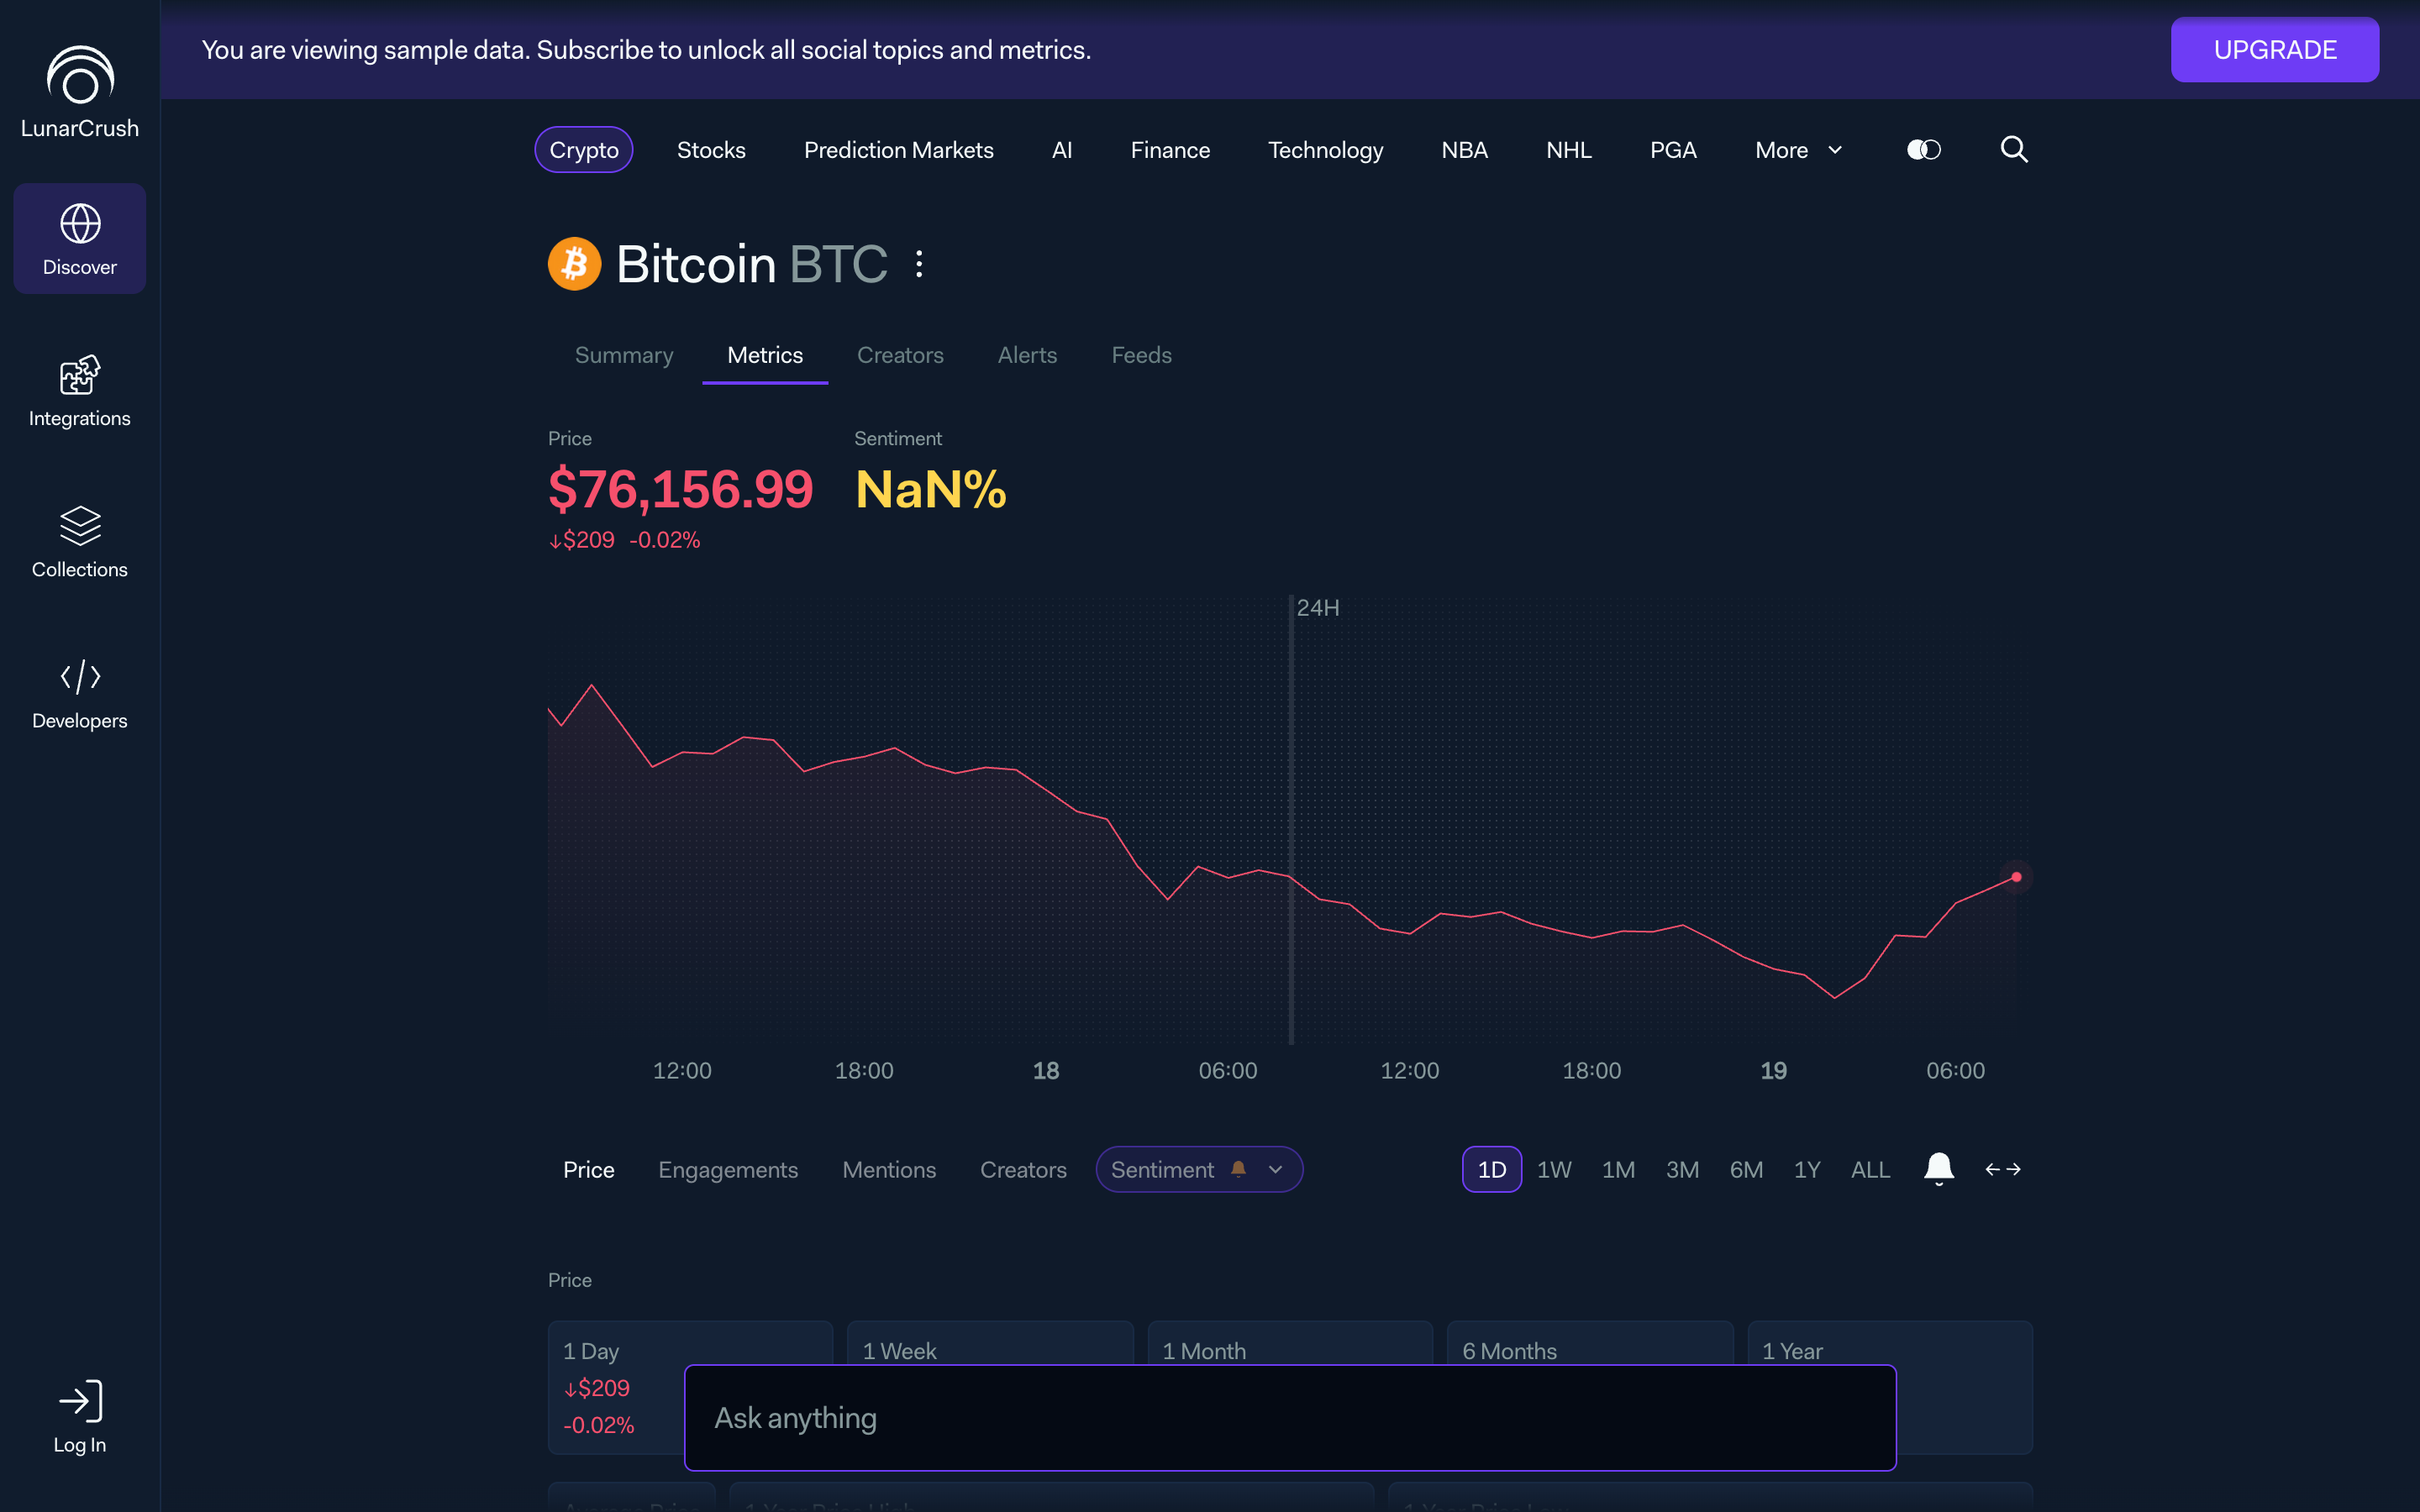
The preview layer is the part I am proudest of. It means users can investigate without ever leaving context. The back button becomes vestigial. Progressive disclosure, but made real at the interaction level, not announced in a principle doc.
A consequence I had not planned for: error prevention improved for free. Previews are zero cost. Nothing to undo, nothing to navigate back from. Users browse more confidently because the penalty for curiosity is zero.
The AI writes in our components
Every early prototype I built had the AI respond in Markdown. Every early prototype failed the same way. The AI-generated view looked like a different product.
So I stopped. The AI renders in the same components the rest of the app uses: the same tables, the same topic cards, the same mini-charts, the same creator rows. A conversation grows into a long, branching thread, and there is no visual seam between a static page and an AI-authored answer.
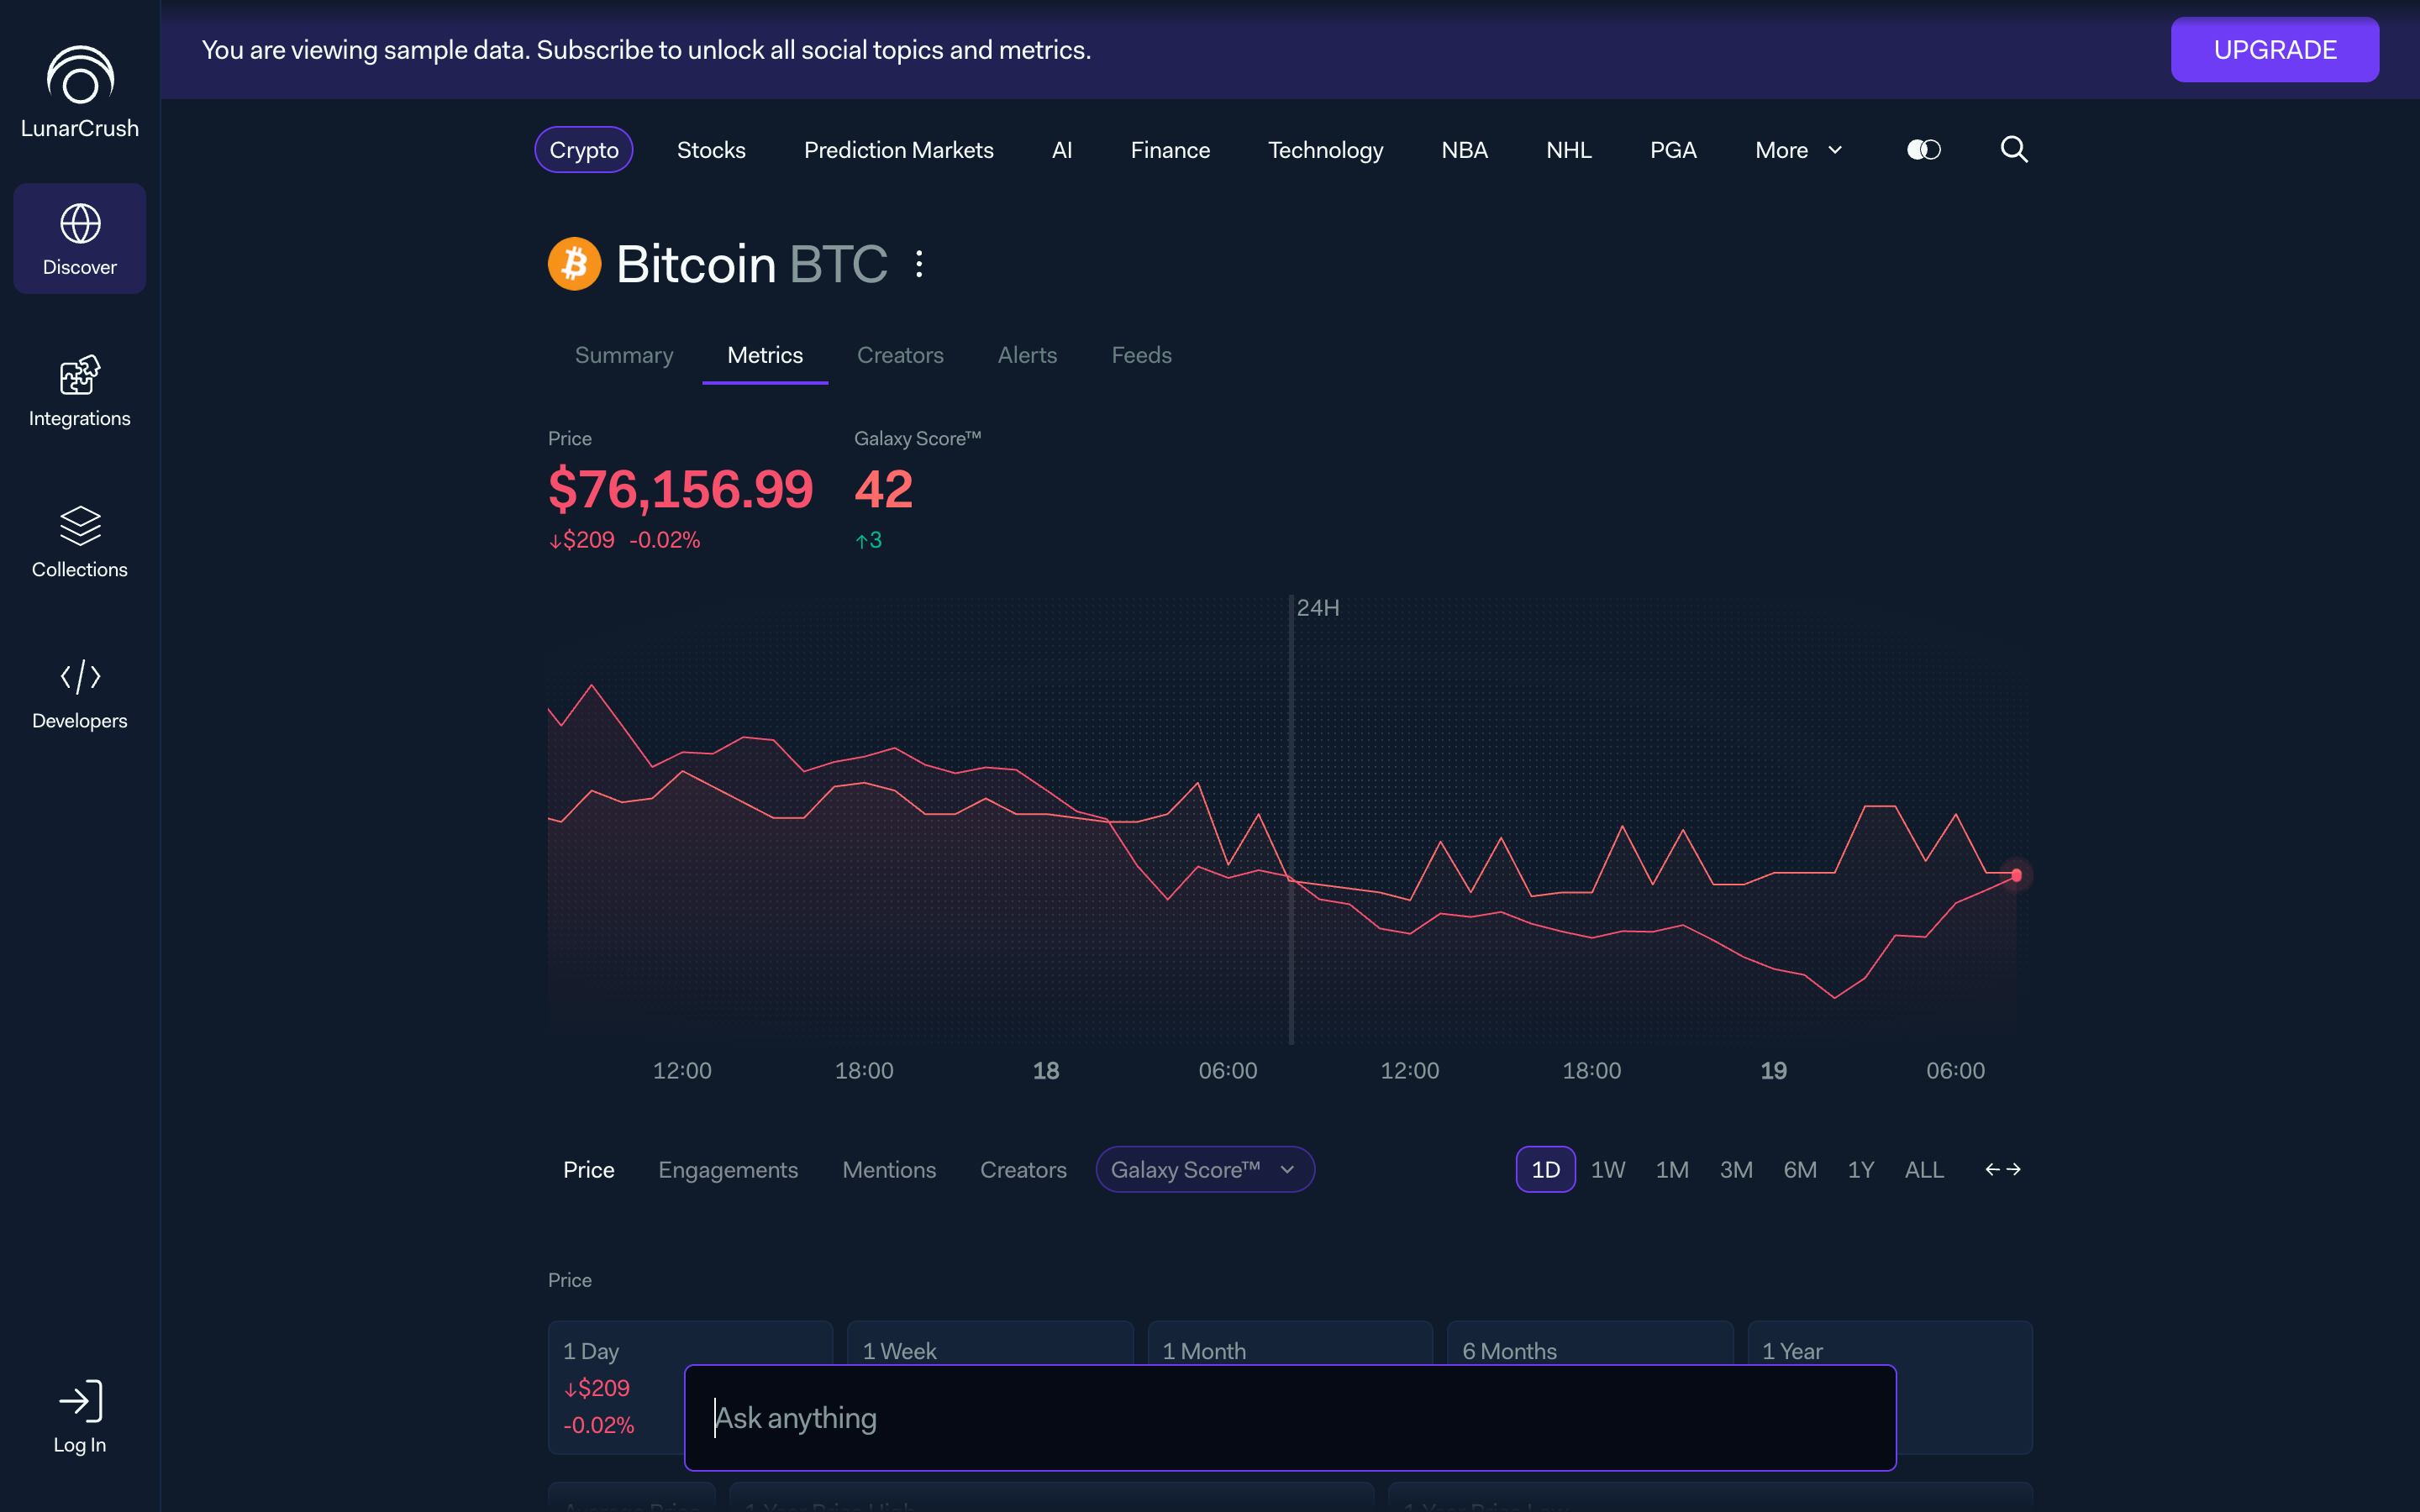
Two things followed from that decision.
First, the visual language holds. There is no AI mode that feels grafted on. The aesthetic-consistency heuristic gets paid for in user comfort. A user who trusts the look of the app trusts the answers of the AI faster.
Second, the components become portable primitives. The same card a user sees inside LunarCrush is the card our MCP server returns when Claude or ChatGPT asks for a topic summary. We reuse the entire design system across surfaces we do not own.
One language, many models
Half of LunarCrush's customers already live outside the web app, paying for API access and never opening the product. I designed accordingly.
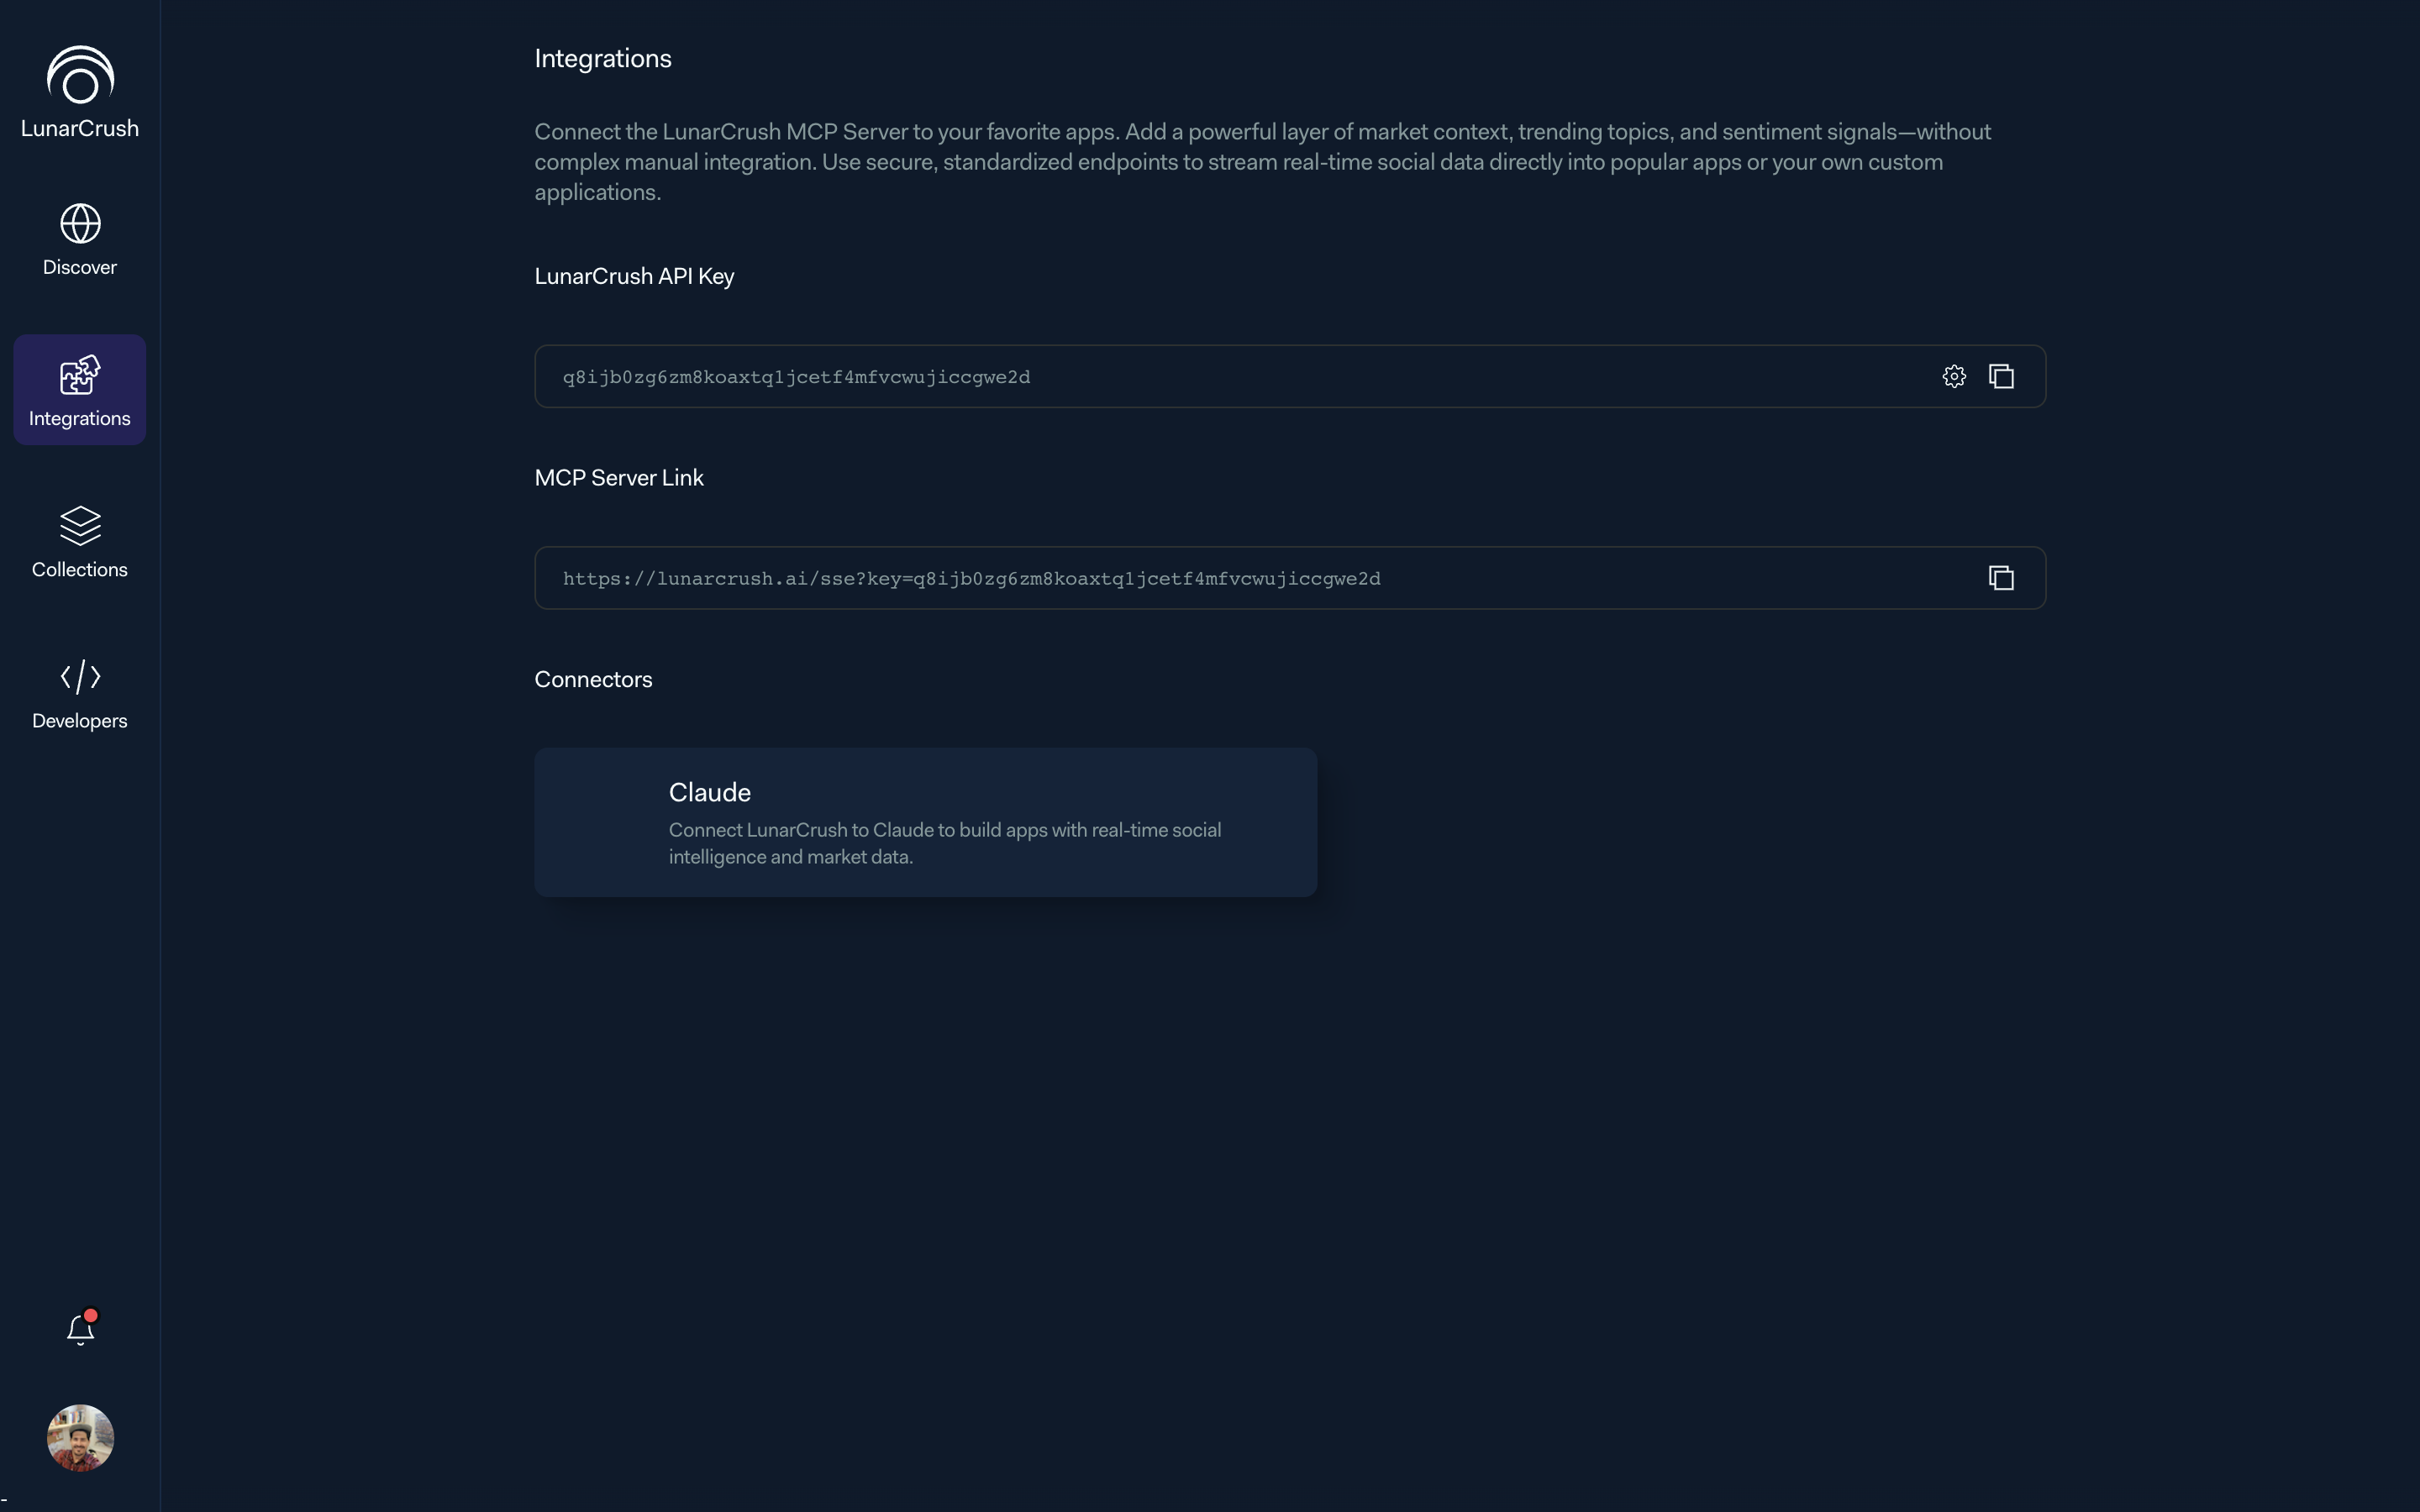
The Integrations surface hands the user three things: their API key, a personal MCP link, and a list of connectors, with Claude first and more on the roadmap. The bet is that the LunarCrush data model should be usable inside whatever LLM the user already has open. The web app is one surface among several, not the canonical one.
The design work that matters here is vocabulary. Topic, category, creator, collection, metric. The MCP server speaks exactly those nouns. A user's mental model built inside the web app travels with them into any model they connect, intact. Everything else, the 700-pixel column, the tab set, the preview layer, is in service of that.
Built for the half that never opens the app
For the developer segment, I designed a parallel inhabitant of the same workspace, not a separate portal.
API usage tracker, endpoint explorer, MCP connection status, quota metrics. All of it lives inside the same shell, under the same tokens, with the same preview-layer behavior. A developer who wants to sanity-check an endpoint does it without leaving the app. A developer who wants to explore as a user simply switches surfaces.
I did not want two products. I wanted one product with two routes through it.
What I took out
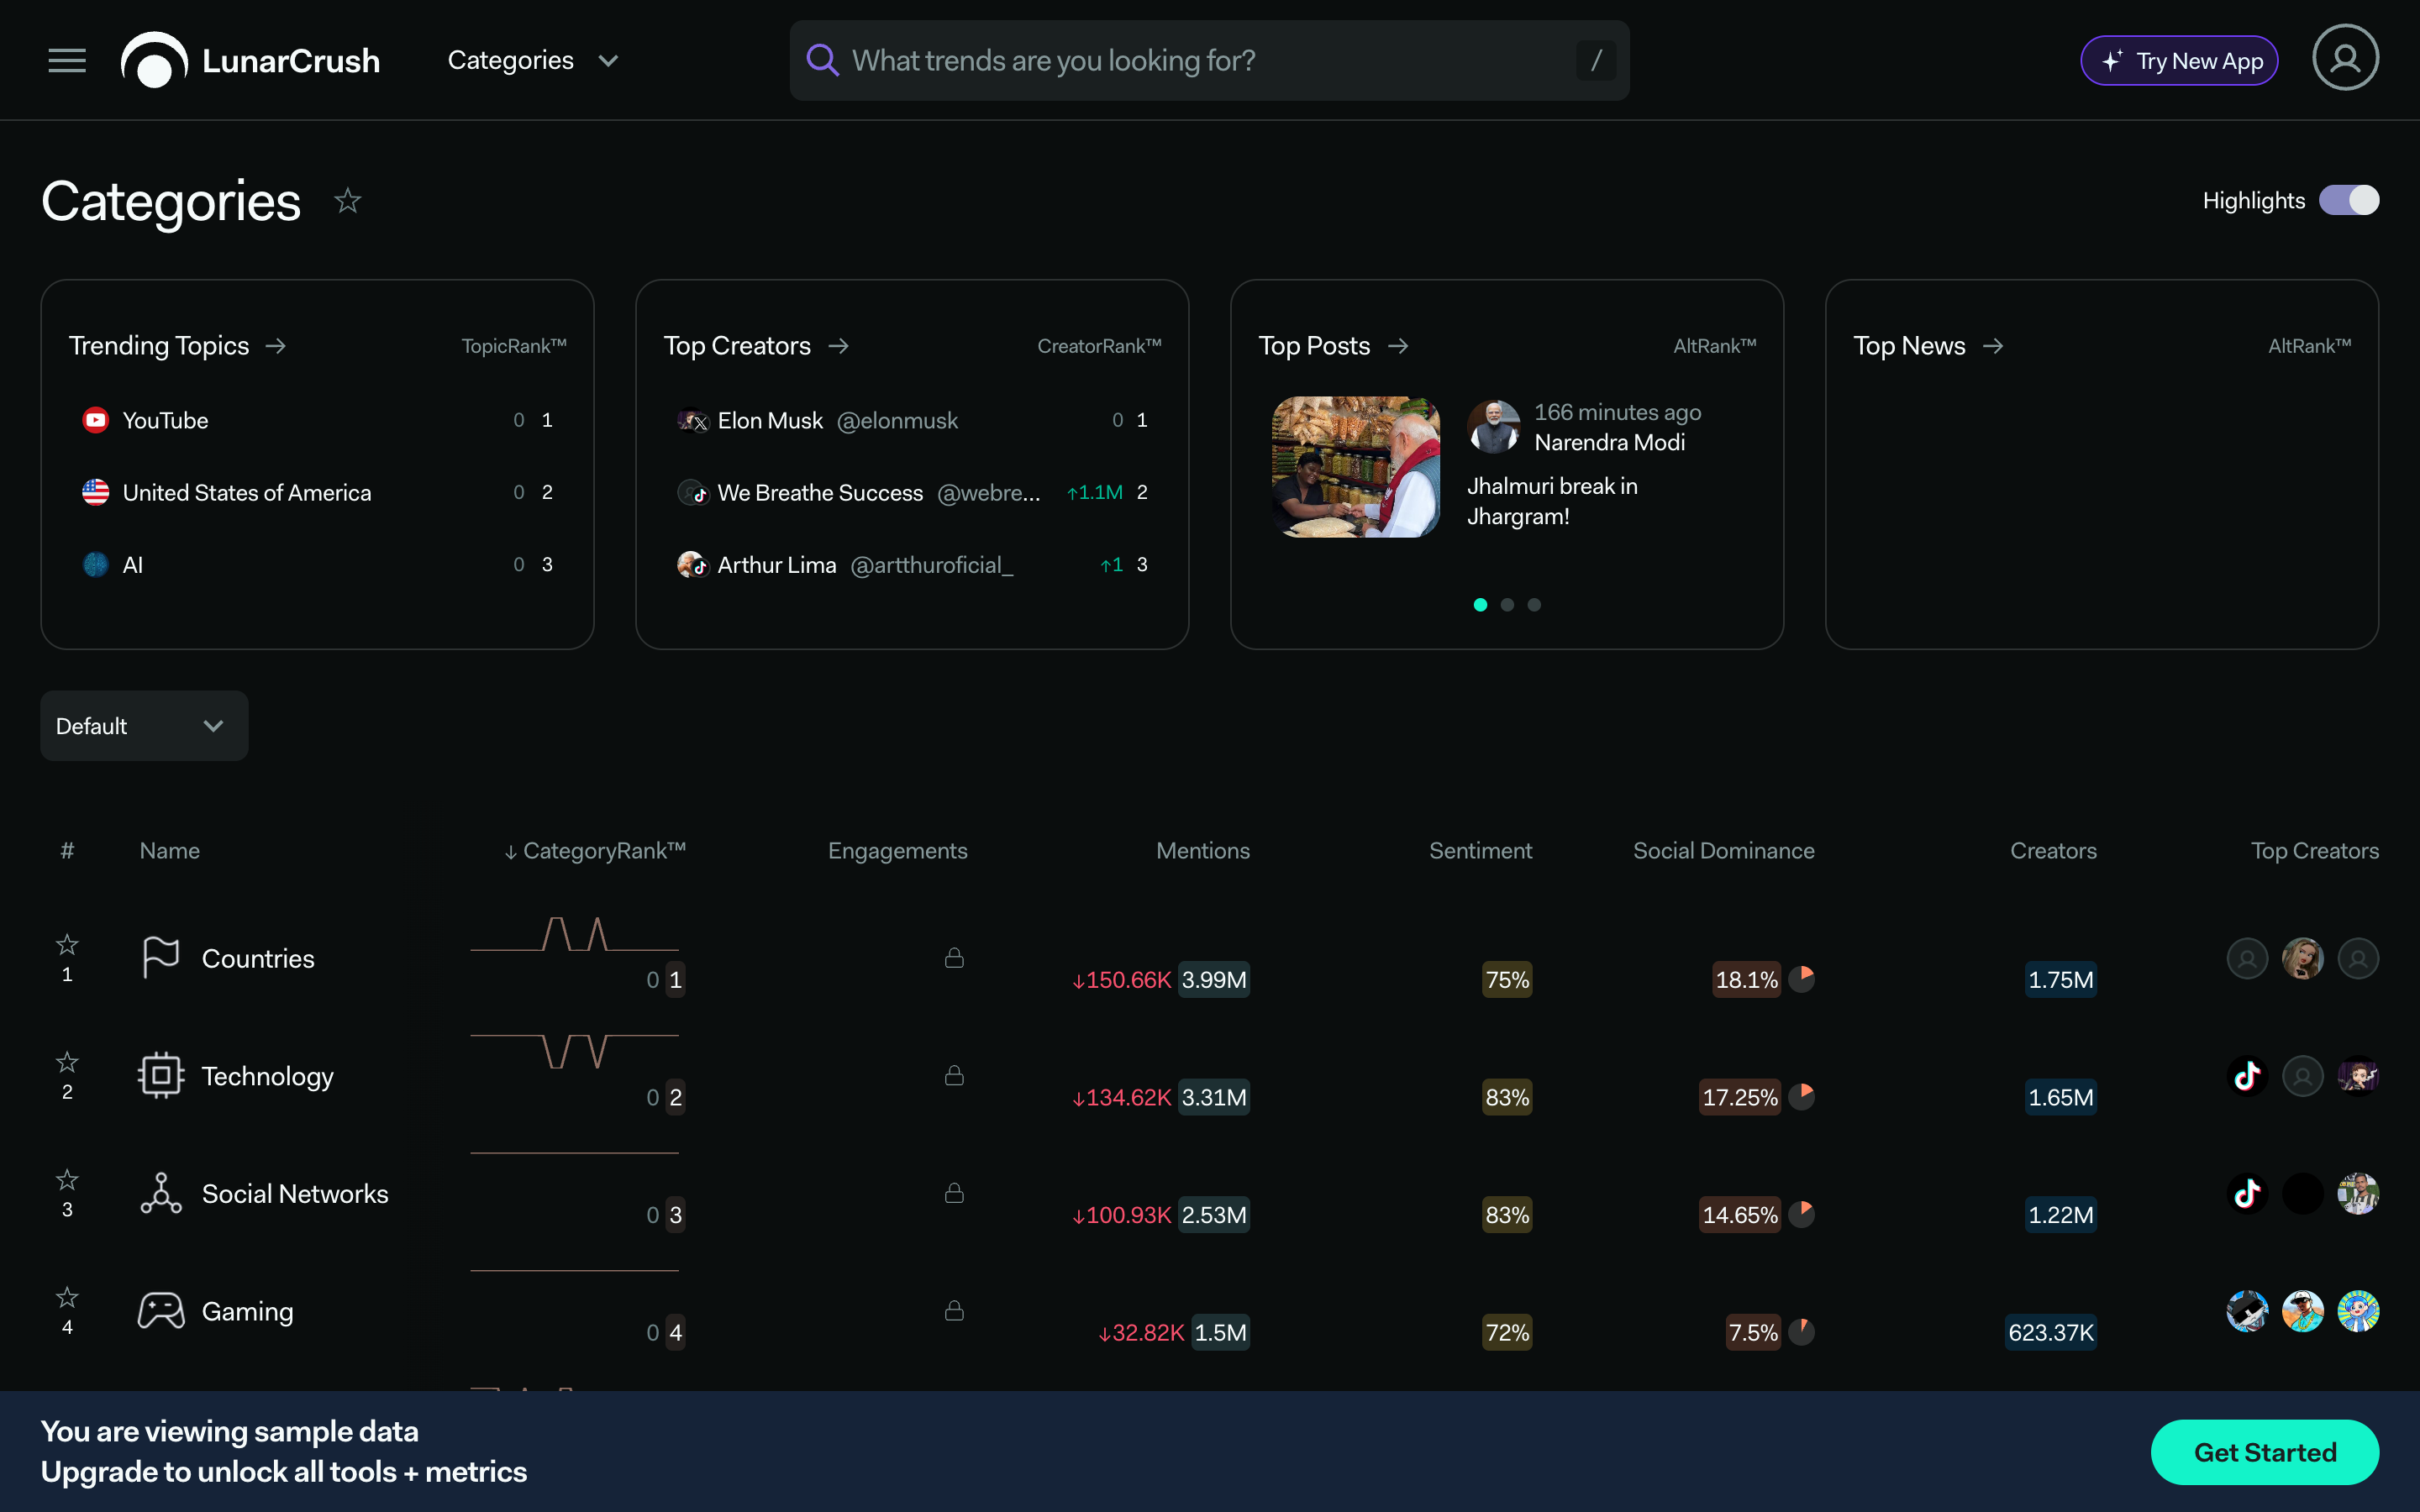
Three surfaces from the old app did not make the cut: Compare (side-by-side topic analysis), the full Categories directory, and the old Creators index.
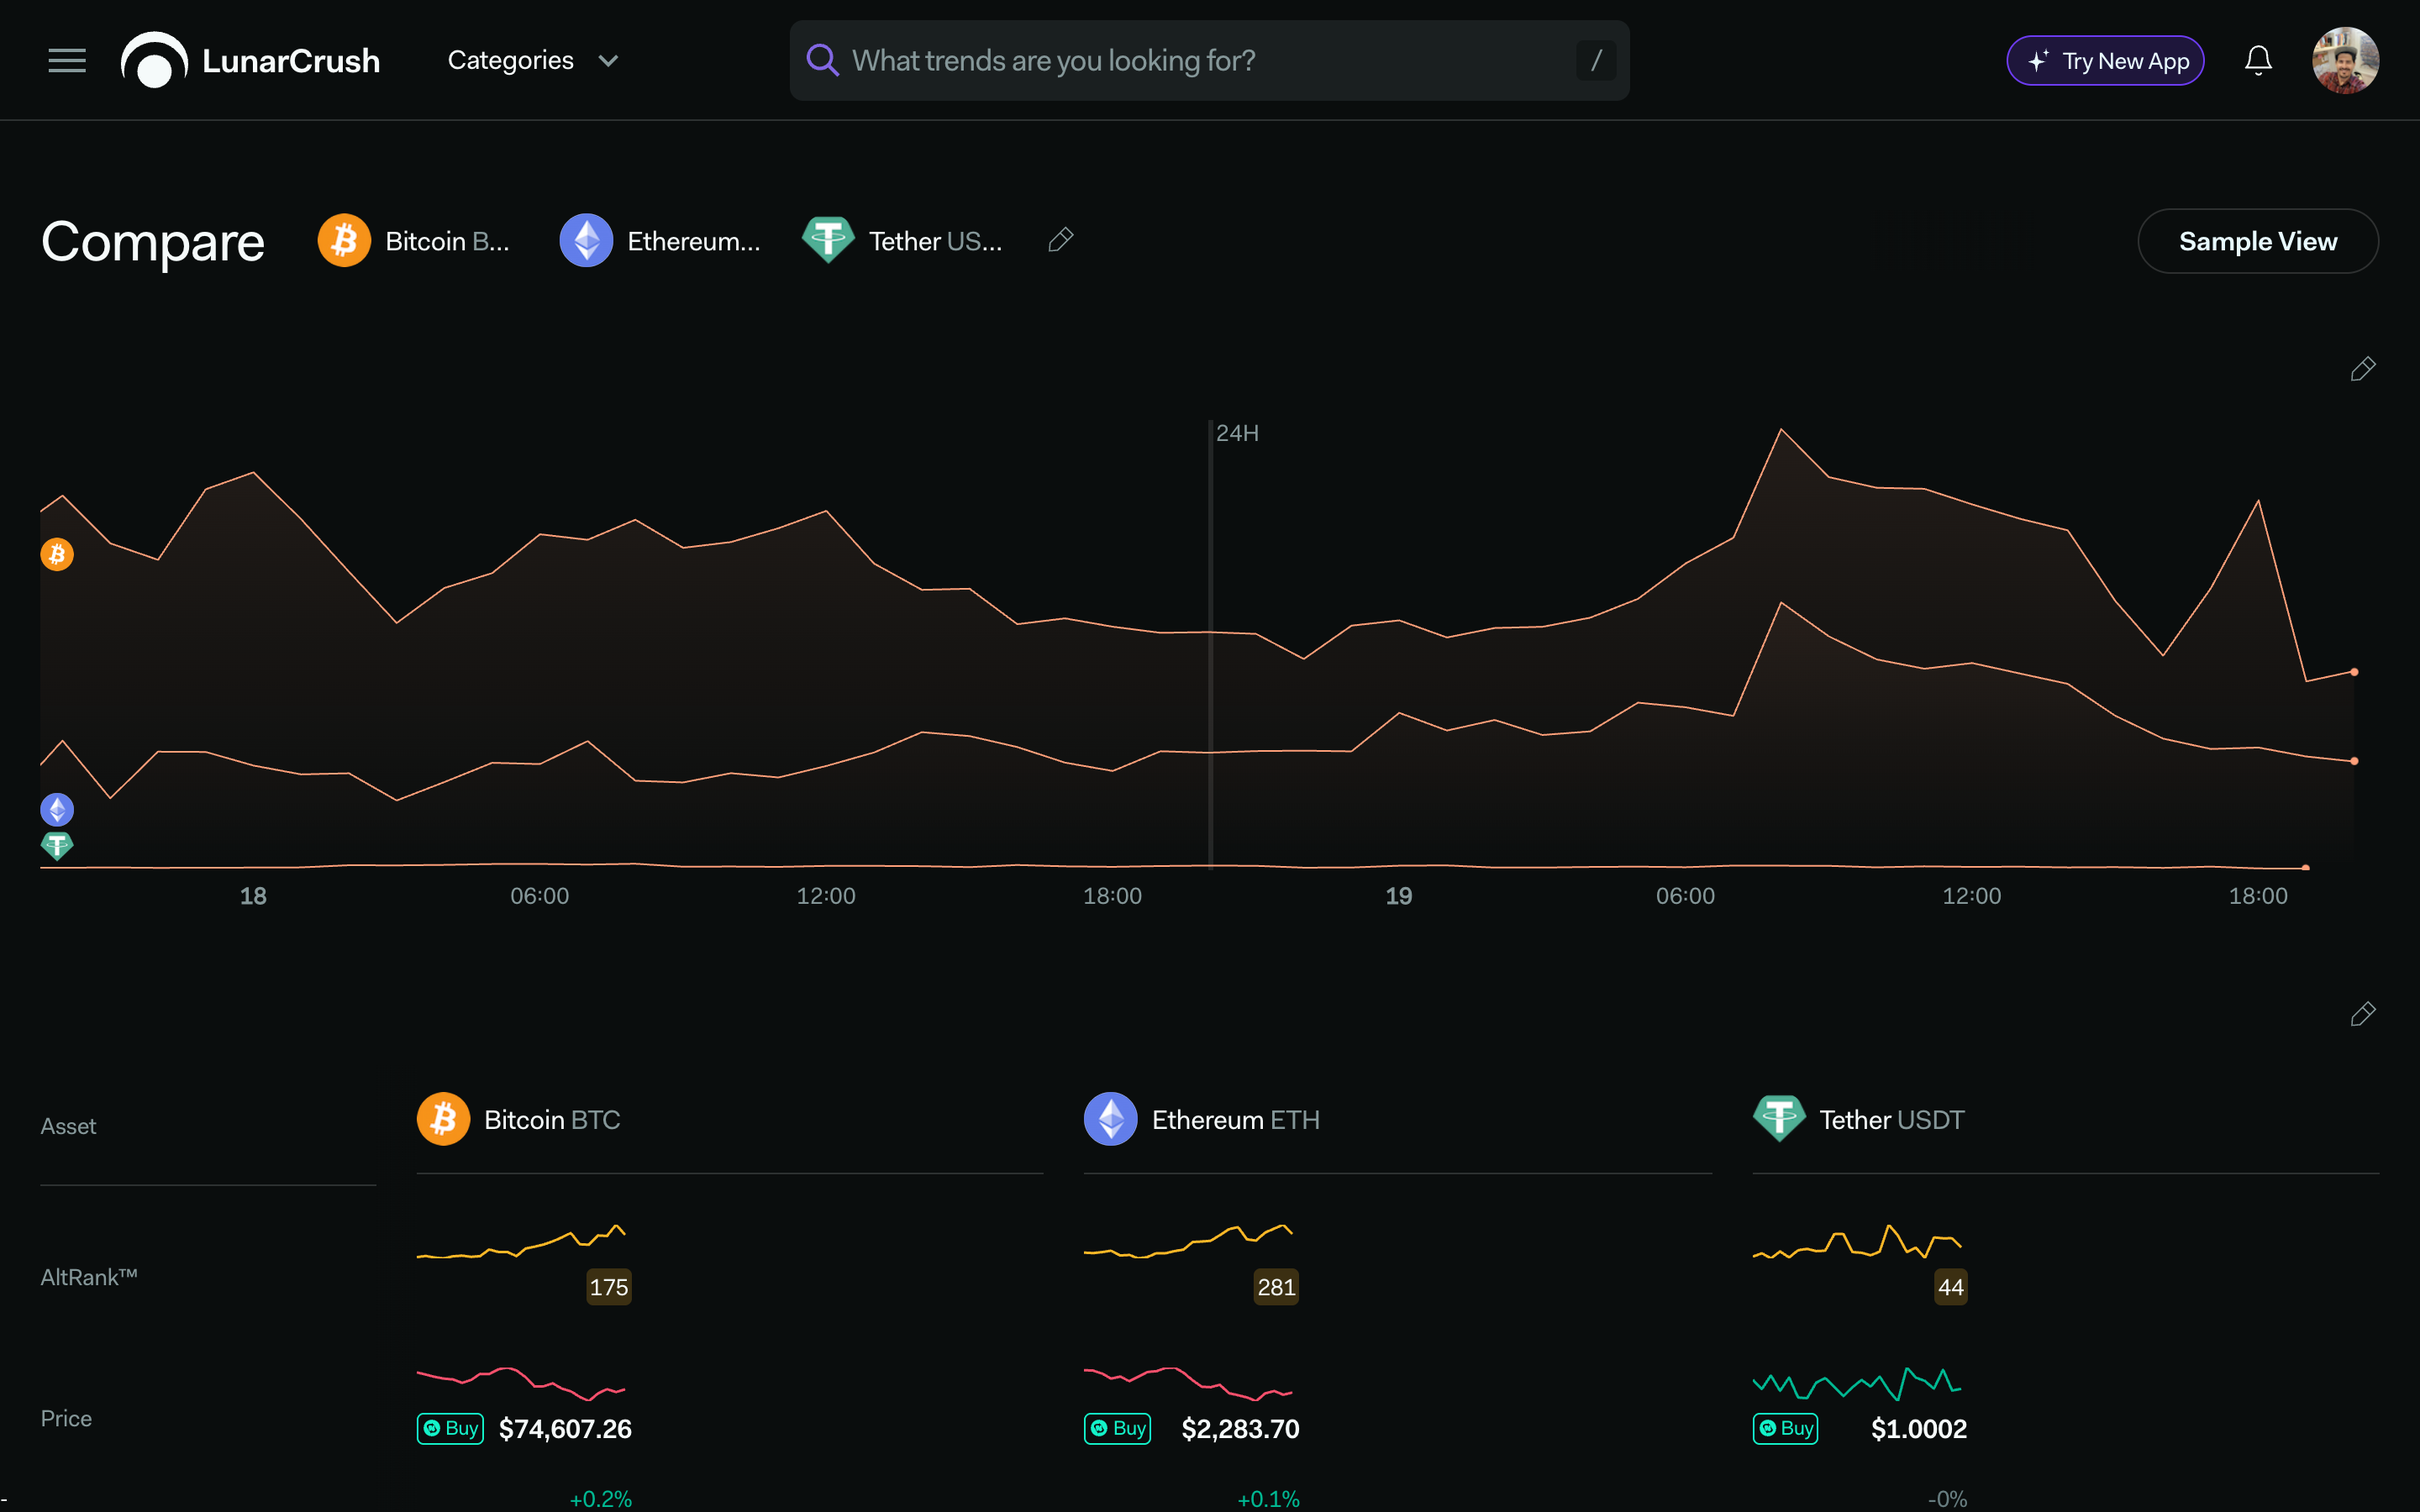
Each one is either a power-user tool or a directory, and both classes work better as a next step inside a conversation than as a destination. A side-by-side comparison is a natural AI-authored answer. A creator lookup becomes a sentence. A category index becomes a sentence too.
They are not gone. They are reachable from Account, under "View old LunarCrush Website". Their return into the new shell will have to be earned with data. The right version of Compare, especially, is a design problem I am working on separately, as an interaction pattern inside the new workspace, not a resurrected page.
How I worked through it
The process was not "design for a month, then ship". The redesign grew out of recurring working sessions with engineering, data, and leadership. We would test how the metrics read when rendered inside a conversation. Which charts survive. Which explanations the model has to carry. Where the hand-off from component to prose happens.
A few decisions that came out of those sessions:
- The adaptive-width column was killed after the third test. It kept breaking the AI reading rhythm.
- The widget grid was killed before it reached prototype. It re-introduced the dashboard fatigue the rebuild was meant to solve.
- The Markdown AI response was killed after two tries. The visual seam was too expensive.
The prototyping loop was Claude Code plus the Figma MCP server, on top of real read-only database access. Every prototype showed live numbers from day one. Design review stopped being "does this layout make sense" and became "does this layout make sense for this actual market condition", a much better question.
What still needs to happen
The rebuild is shipping in phases. Production rollout is scheduled for May 2026. Attribution has to be careful for now.
The baselines we are measuring against are the ones from the audit: 15.7% monthly churn, the funnel that drops 28,600 landing visitors to roughly 60 returning users, the 5.4× activity ratio between API users and app users, the 97% Collections engagement among power users, and the MCP signal of more than 399 Claude-driven signups now representing 43% of all signups.
The outcome measurement starts after production rollout. Churn delta at +30, +90 and +180 days. Prompt usage per session. Conversation depth. Integration activations. Developer-view return rate. Funnel return rate against the 5% baseline.
Closing
What I am building is not a redesign. It is the shape that a product takes when its users have stopped wanting destinations and started wanting answers. The 700-pixel column, the topic primitive, the preview layer, the AI rendering in native components, the MCP vocabulary; each of those is a small bet on that future. The point of writing them down here is to remember that none of them happened by accident.
Role: Head of Design, LunarCrush. January 2021 to present.
Related work: The Product · The Rebuild · Compare · Landing Pages · Trading Bot.
References: Nielsen's 10 Usability Heuristics. Hick's Law. Fitts's Law. Norman, The Design of Everyday Things. Google Finance Beta as primary industry reference.